


This Is The Income Needed To Join The Top 1% In Every State
What it takes to join the top 1% of earners varies across the United States.
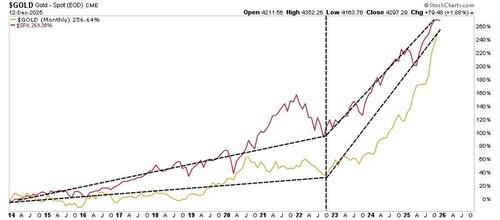
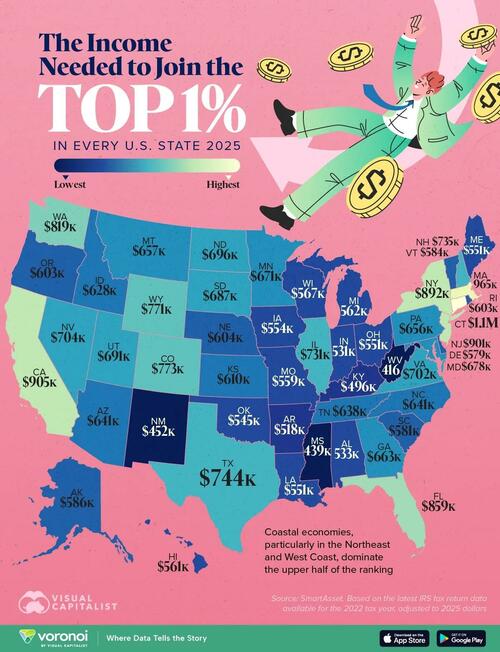
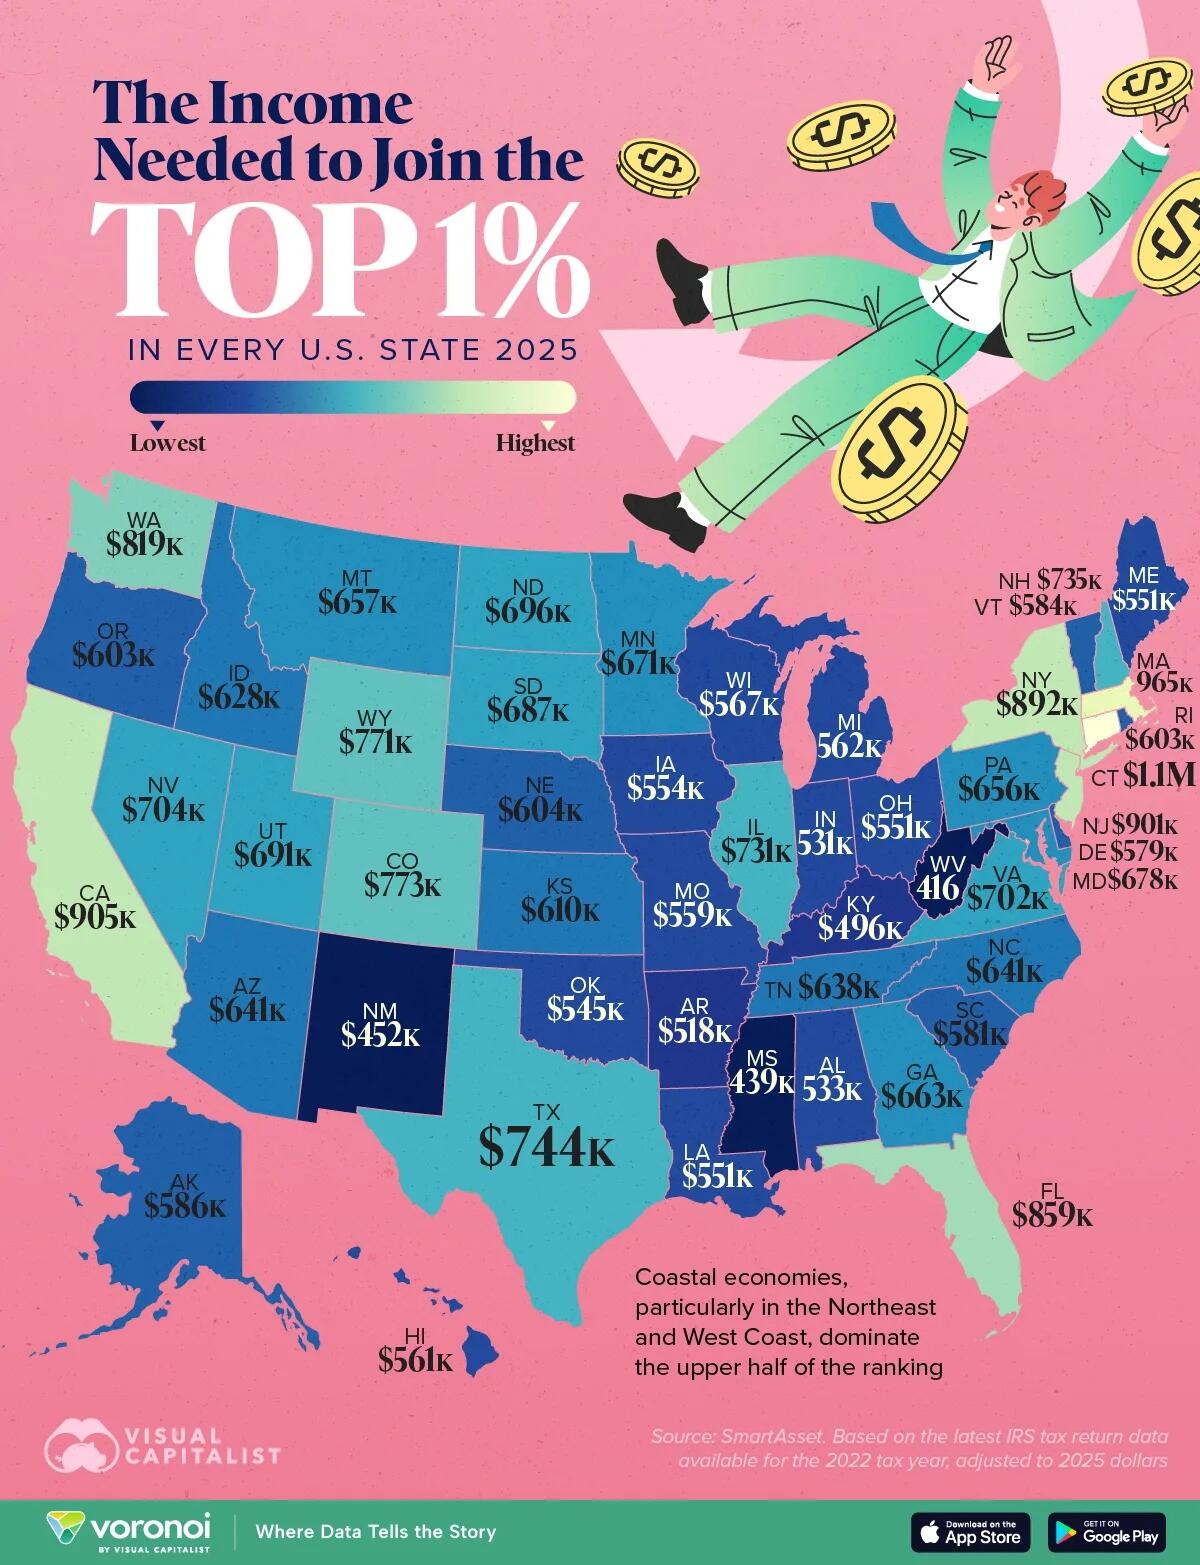
This map, via Visual Capitalist’s Bruno Venditti, highlights the income floor required to enter the wealthiest bracket in each state for 2025.
The spread is wide, stretching from over $1 million at the top to barely $400,000 in less wealthy states.
High-paying industries like finance, technology, and professional services cluster in coastal states, pushing top incomes even higher. Meanwhile, states with smaller economies and lower costs of living require far less to reach the elite group.
The data for this visualization comes from SmartAsset. It ranks all 50 states by the annual income required to enter the top 1%, based on tax return data. The table below also includes the number of households in this bracket and the corresponding income floor for the top 5%.
Where You Need the Most to Join the 1%
Connecticut tops the list with a $1,056,996 income floor, making it the only state above the $1 million mark.
Rank
State
Top 1% of earners
# of top 1% returns
Top 5% of earners
1
Connecticut
$1,056,996
16,917
$362,263
2
Massachusetts
$965,170
32,795
$378,434
3
California
$905,396
175,045
$353,073
4
New Jersey
$901,082
43,042
$367,108
5
New York
$891,640
91,840
$307,753
6
Florida
$859,381
105,101
$281,811
7
Washington
$819,101
35,597
$355,767
8
Colorado
$772,989
27,685
$318,659
9
Wyoming
$771,369
2,611
$255,320
10
Texas
$743,955
128,130
$284,661
11
New Hampshire
$735,374
6,796
$311,145
12
Illinois
$731,202
56,794
$292,729
13
Nevada
$703,713
14,754
$248,739
14
Virginia
$701,792
39,103
$314,694
15
North Dakota
$695,759
3,431
$272,755
16
Utah
$690,548
13,991
$270,645
17
South Dakota
$687,190
4,062
$255,851
18
Maryland
$677,543
29,040
$304,250
19
Minnesota
$671,408
26,423
$285,607
20
Georgia
$662,821
46,220
$267,958
21
Montana
$656,830
5,101
$251,774
22
Pennsylvania
$655,636
58,541
$272,141
23
Arizona
$641,262
31,872
$261,362
24
North Carolina
$640,783
46,525
$268,730
25
Tennessee
$638,299
30,531
$247,765
26
Idaho
$627,839
8,145
$249,451
27
Kansas
$609,946
12,643
$253,834
28
Nebraska
$603,899
8,660
$251,139
29
Rhode Island
$603,162
5,224
$258,276
30
Oregon
$603,006
19,053
$270,877
31
Alaska
$586,381
3,223
$266,499
32
Vermont
$583,559
3,123
$249,931
33
South Carolina
$580,600
23,203
$241,531
34
Delaware
$578,580
4,726
$260,787
35
Wisconsin
$566,711
27,293
$242,066
36
Michigan
$561,582
45,218
$241,403
37
Hawaii
$561,147
6,472
$249,850
38
Missouri
$559,043
26,898
$237,461
39
Iowa
$554,046
13,821
$241,591
40
Louisiana
$551,125
18,593
$225,674
41
Maine
$550,936
6,618
$236,338
42
Ohio
$550,724
53,103
$232,196
43
Oklahoma
$544,679
16,106
$224,074
44
Alabama
$532,600
20,185
$226,634
45
Indiana
$531,332
30,120
$227,098
46
Arkansas
$517,761
12,198
$217,087
47
Kentucky
$496,281
18,395
$215,196
48
New Mexico
$451,639
9,310
$211,101
49
Mississippi
$439,479
11,731
$195,171
50
West Virginia
$416,310
7,316
$196,335
Massachusetts ($965,170) and California ($905,396) follow in second and third place, both supported by large, high-skill job markets. States in the Northeast and along the West Coast dominate the top positions due to dense economic activity and elevated earnings in specialized industries.
Middle-Tier States Still Require High Earnings
States like Colorado, Washington, and Virginia sit in the upper-middle tier, requiring between $700,000 and $820,000 to qualify for the top 1%. These states benefit from fast-growing metropolitan areas, strong tech or government-driven employment, and rising household incomes.
Even in energy-focused states such as Wyoming and North Dakota, the income floors exceed $690,000, showing how pockets of high-paying industries influence overall thresholds.
The Most Affordable States for Top 1% Status
At the bottom of the ranking, West Virginia’s $416,310 threshold is the lowest in the country, followed by Mississippi ($439,479) and New Mexico ($451,639). Lower costs of living, smaller urban job markets, and fewer high-paying industry clusters contribute to these more modest thresholds.
If you enjoyed today’s post, check out Visualizing the Cost of the American Dream on Voronoi, the new app from Visual Capitalist.
Tyler Durden
Fri, 11/28/2025 – 07:45