


Which US States Are Seeing Incomes Rise The Fastest (And Slowest)
Since 2019, U.S. household incomes have surged – rising from $68,700 to $83,730 nationally, a 21.9% increase in just five years.
But where you live matters a lot.
While some states tracked close to the national average, others saw incomes climb at nearly double the pace, driven by booming local industries and major investment.
States like Colorado posted outsized gains, while Georgia’s expanding EV industry brought billions in investment and rising paychecks.
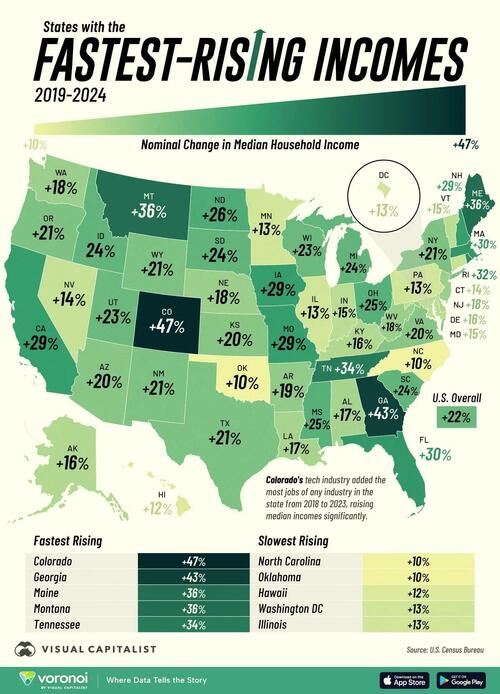
The map, via Visual Capitalist’s Dorothy Neufeld, shows which states saw the fastest growth in median household income from 2019 to 2024, using data from the U.S. Census Bureau.
Trends in Median Income by State
Below, we show the change in median household income for all 50 U.S. states and D.C. between 2019 and 2024 using nominal figures (not adjusted for inflation):
Rank
State
Change in Median Household Income
2019-2024
Median Household Income 2019
Median Household Income 2024
1
Colorado
46.9%
$72,500
$106,500
2
Georgia
43.4%
$56,630
$81,210
3
Maine
36.3%
$66,550
$90,730
4
Montana
36.1%
$60,190
$81,920
5
Tennessee
34.0%
$56,630
$75,860
6
Rhode Island
31.6%
$70,150
$92,290
7
Massachusetts
29.9%
$87,710
$113,900
8
Florida
29.6%
$58,370
$75,630
9
Iowa
29.4%
$66,050
$85,480
10
Missouri
29.4%
$60,600
$78,390
11
California
28.8%
$78,100
$100,600
12
New Hampshire
28.7%
$86,900
$111,800
13
North Dakota
25.8%
$70,030
$88,080
14
Mississippi
25.0%
$44,790
$55,980
15
Ohio
24.5%
$64,660
$80,520
16
South Dakota
24.3%
$64,260
$79,850
17
Michigan
23.9%
$64,120
$79,460
18
South Carolina
23.8%
$62,030
$76,780
19
Idaho
23.7%
$65,990
$81,650
20
Utah
23.0%
$84,520
$104,000
21
Wisconsin
22.6%
$67,350
$82,560
22
New York
20.8%
$71,850
$86,830
23
Texas
20.8%
$67,440
$81,490
24
Wyoming
20.8%
$65,130
$78,680
25
New Mexico
20.8%
$53,110
$64,140
26
Oregon
20.5%
$74,410
$89,700
27
Virginia
20.2%
$81,310
$97,720
28
Kansas
19.9%
$73,150
$87,690
29
Arizona
19.9%
$70,670
$84,700
30
Arkansas
18.9%
$54,540
$64,840
31
Washington
18.3%
$82,450
$97,500
32
New Jersey
18.0%
$87,730
$103,500
33
Nebraska
17.9%
$73,070
$86,140
34
West Virginia
17.6%
$53,710
$63,150
35
Louisiana
17.5%
$51,710
$60,740
36
Alabama
16.7%
$56,200
$65,560
37
Alaska
16.4%
$78,390
$91,260
38
Kentucky
16.4%
$55,660
$64,790
39
Delaware
15.7%
$74,190
$85,860
40
Indiana
15.0%
$66,690
$76,710
41
Maryland
14.8%
$95,570
$109,700
42
Vermont
14.7%
$74,310
$85,260
43
Connecticut
13.7%
$87,290
$99,240
44
Nevada
13.7%
$70,910
$80,590
45
Pennsylvania
13.4%
$70,580
$80,060
46
Minnesota
13.4%
$81,430
$92,350
47
Illinois
13.2%
$74,400
$84,210
48
District of Columbia
12.6%
$93,110
$104,800
49
Hawaii
11.6%
$88,010
$98,240
50
Oklahoma
9.9%
$59,400
$65,310
51
North Carolina
9.9%
$61,160
$67,220
Colorado’s thriving tech industry helped push median income up 46.9%, the fastest rise across states.
With $165,606 in average earnings across the sector in 2023, Colorado ranked sixth-highest nationally. From software to renewable energy, employment growth has expanded by double- or even triple-digit percentages across various roles since 2018.
Georgia ranks in a close second, with median incomes climbing 43.4%. In particular, the EV and aerospace sectors are playing a key role in job creation. Since 2018, the state has seen $27.3 billion in investment across EV, aerospace, and battery manufacturers including Rivian and SK Battery America.
Maine, meanwhile, saw wages rise 36.3%. In 2024, wages across the tech sector saw the steepest jump of 11.4% while those in the construction sector saw strong gains of 8.5%. Other factors, such as its older population and tight labor market, have further boosted wages.
Falling near the middle of the pack were New York and Texas, each with wage gains of 20.8% between 2019 and 2024.
By contrast, North Carolina and Oklahoma saw only 9.9% cumulative wage growth, the weakest performance nationwide. Median household income in both states remains well below the U.S. average and still trails pre-pandemic levels.
To learn more about this topic, check out this graphic on average hourly earnings by state in 2025.
Tyler Durden
Sat, 02/14/2026 – 22:45