


Israel Dominates Claude AI Usage Around The World
New data from Anthropic reveals where its Claude AI chatbot is gaining the most traction worldwide.
While Israel tops the overall ranking, the United States leads among countries with at least 10,000 Claude conversations, scoring 3.69x on the index.
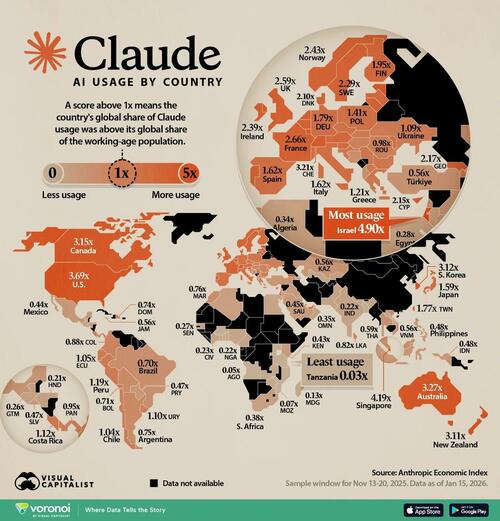
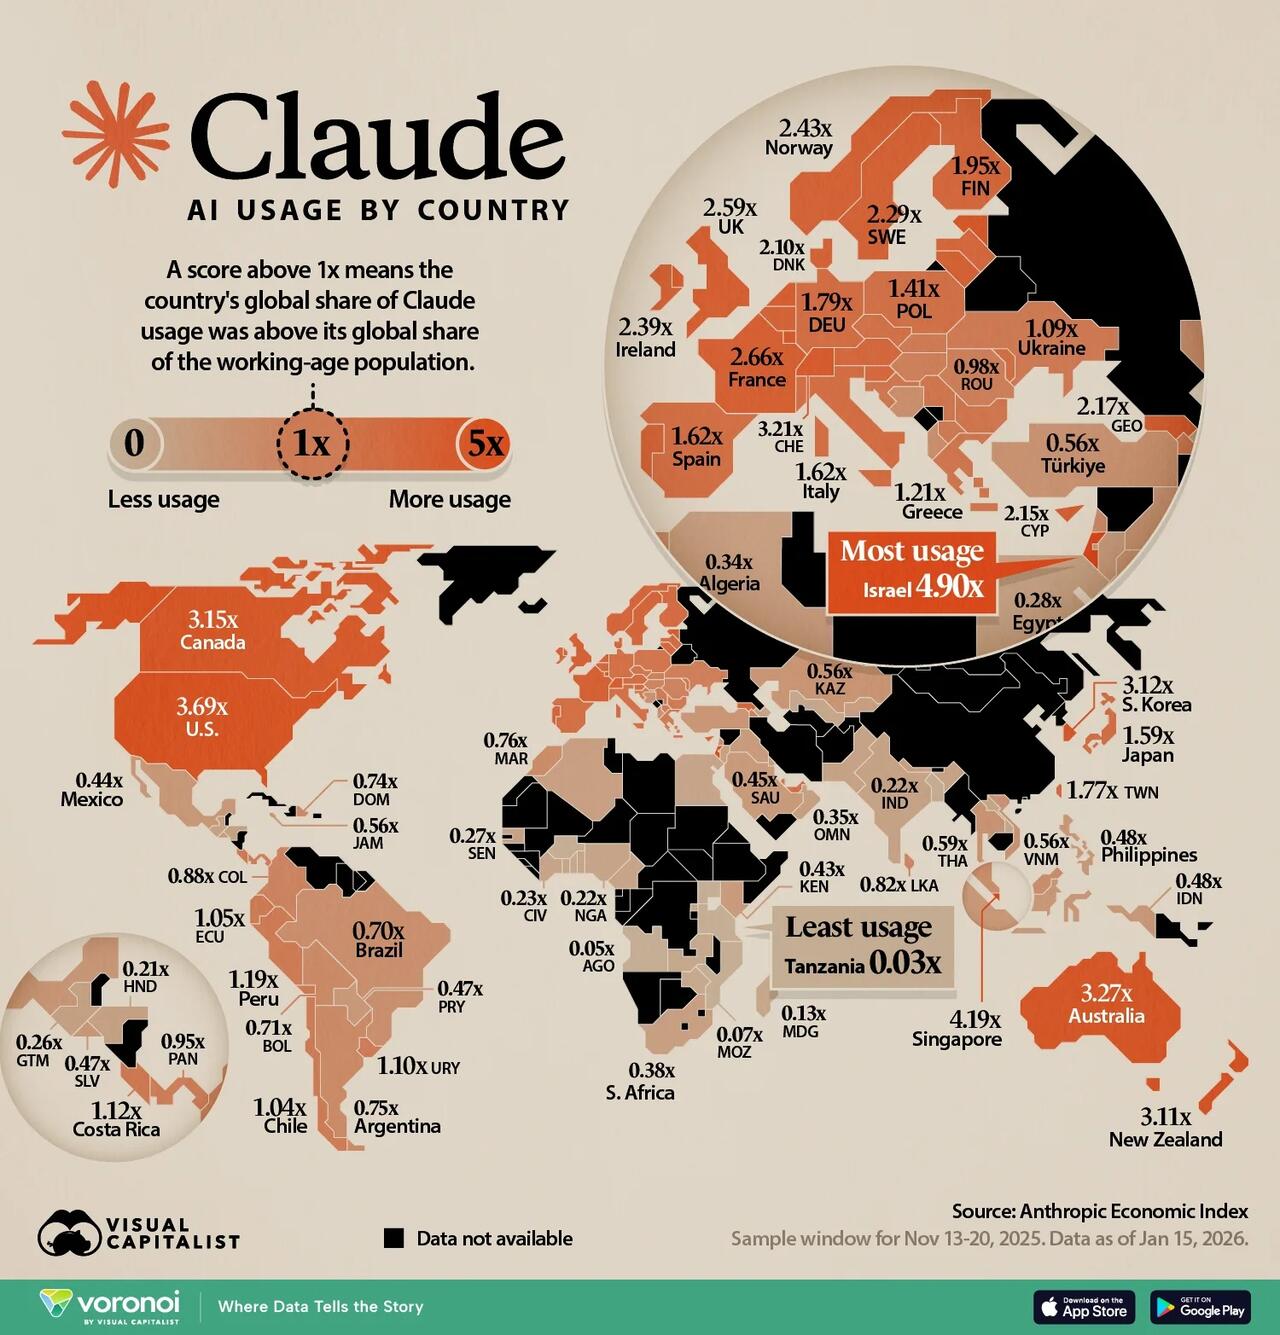
This visualization, via Visual Capitalist’s Tasmin Lockwood, maps which countries use it the most relative to their working-age population, according to the Anthropic AI Usage Index.
Where Claude Usage Is Highest by Country
Dive into the data below, which was collected across 116 countries in the week of Nov 13-20, 2025.
Each score represents usage relative to what would be expected based on a country’s working-age population.
Rank
Index score
1
🇮🇱 Israel
4.90x
2
🇸🇬 Singapore
4.19x
3
🇺🇸 United States
3.69x
4
🇦🇺 Australia
3.27x
5
🇨🇭 Switzerland
3.21x
6
🇨🇦 Canada
3.15x
7
🇰🇷 South Korea
3.12x
8
🇳🇿 New Zealand
3.11x
9
🇱🇺 Luxembourg
3.07x
10
🇪🇪 Estonia
3.05x
11
🇫🇷 France
2.66x
12
🇲🇹 Malta
2.63x
13
🇳🇱 The Netherlands
2.61x
14
🇬🇧 United Kingdom
2.59x
15
🇳🇴 Norway
2.43x
16
🇮🇪 Ireland
2.39x
17
🇸🇪 Sweden
2.29x
18
🇵🇹 Portugal
2.23x
19
🇧🇪 Belgium
2.17x
20
🇬🇪 Georgia
2.17x
21
🇨🇾 Cyprus
2.15x
22
🇩🇰 Denmark
2.10x
23
🇱🇹 Lithuania
2.09x
24
🇫🇮 Finland
1.95x
25
🇱🇻 Latvia
1.92x
26
🇦🇹 Austria
1.88x
27
🇸🇮 Slovenia
1.85x
28
🇩🇪 Germany
1.79x
29
🇹🇼 Taiwan
1.77x
30
🇪🇸 Spain
1.62x
31
🇮🇹 Italy
1.62x
32
🇦🇪 United Arab Emirates
1.61x
33
🇯🇵 Japan
1.59x
34
🇨🇿 Czechia
1.54x
35
🇲🇩 Moldova
1.47x
36
🇵🇱 Poland
1.41x
37
🇶🇦 Qatar
1.39x
38
🇧🇬 Bulgaria
1.33x
39
🇭🇷 Croatia
1.31x
40
🇷🇸 Serbia
1.24x
41
🇲🇺 Mauritius
1.24x
42
🇬🇷 Greece
1.21x
43
🇵🇪 Peru
1.19x
44
🇹🇳 Tunisia
1.14x
45
🇨🇷 Costa Rica
1.12x
46
🇺🇾 Uruguay
1.10x
47
🇺🇦 Ukraine
1.09x
48
🇸🇰 Slovakia
1.08x
49
🇲🇰 North Macedonia
1.08x
50
🇪🇨 Ecuador
1.05x
51
🇨🇱 Chile
1.04x
52
🇭🇺 Hungary
0.98x
53
🇷🇴 Romania
0.98x
54
🇦🇲 Armenia
0.97x
55
🇵🇦 Panama
0.95x
56
🇹🇹 Trinidad and Tobago
0.93x
57
🇵🇷 Puerto Rico
0.92x
58
🇨🇴 Colombia
0.88x
59
🇧🇭 Bahrain
0.85x
60
🇱🇰 Sri Lanka
0.82x
61
🇱🇧 Lebanon
0.78x
62
🇲🇦 Morocco
0.76x
63
🇦🇷 Argentina
0.75x
64
🇩🇴 Dominican Republic
0.74x
65
🇧🇴 Bolivia
0.71x
66
🇧🇷 Brazil
0.70x
67
🇦🇱 Albania
0.68x
68
🇲🇾 Malaysia
0.66x
69
🇧🇦 Bosnia and Herzegovina
0.60x
70
🇹🇭 Thailand
0.59x
71
🇯🇲 Jamaica
0.56x
72
🇹🇷 Turkey
0.56x
73
🇻🇳 Vietnam
0.56x
74
🇰🇿 Kazakhstan
0.56x
75
🇮🇩 Indonesia
0.48x
76
🇵🇭 Philippines
0.48x
77
🇵🇾 Paraguay
0.47x
78
🇸🇻 El Salvador
0.47x
79
🇸🇦 Saudi Arabia
0.45x
80
🇲🇽 Mexico
0.44x
81
🇮🇶 Iraq
0.43x
82
🇰🇪 Kenya
0.43x
83
🇿🇦 South Africa
0.38x
84
🇯🇴 Jordan
0.37x
85
🇰🇼 Kuwait
0.37x
86
🇰🇬 Kyrgyzstan
0.35x
87
🇴🇲 Oman
0.35x
88
🇩🇿 Algeria
0.34x
89
🇵🇸 Palestinian Territory
0.32x
90
🇳🇵 Nepal
0.32x
91
🇷🇼 Rwanda
0.30x
92
🇦🇿 Azerbaijan
0.29x
93
🇪🇬 Egypt
0.28x
94
🇬🇭 Ghana
0.27x
95
🇸🇳 Senegal
0.27x
96
🇬🇹 Guatemala
0.26x
97
🇧🇯 Benin
0.25x
98
🇨🇲 Cameroon
0.23x
99
🇨🇮 Ivory Coast
0.23x
100
🇵🇰 Pakistan
0.22x
101
🇮🇳 India
0.22x
102
🇳🇬 Nigeria
0.22x
103
🇭🇳 Honduras
0.21x
104
🇱🇦 Laos
0.20x
105
🇰🇭 Cambodia
0.19x
106
🇹🇬 Togo
0.17x
107
🇿🇼 Zimbabwe
0.15x
108
🇺🇿 Uzbekistan
0.13x
109
🇲🇬 Madagascar
0.13x
110
🇿🇲 Zambia
0.11x
111
🇧🇫 Burkina Faso
0.10x
112
🇧🇩 Bangladesh
0.09x
113
🇺🇬 Uganda
0.09x
114
🇲🇿 Mozambique
0.07x
115
🇦🇴 Angola
0.05x
116
🇹🇿 Tanzania
0.03x
Israel topped the Anthropic AI Usage Index at 4.9x, putting it well ahead of other countries. Israel has been labeled the “Start-up Nation” since a book of the same name charted its rapid growth and technological innovation.
Singapore has the second-highest uptake at 4.19x. The small city-state also performed well on last year’s Global Innovation Index, which ranks countries on research and entrepreneurship.
Because the index measures usage relative to workforce size, smaller tech-driven economies can rank highly even if their overall user base is smaller.
However, among countries with at least 10,000 conversations, the United States leads at 3.69x. It also dominates in share of actual usage, though raw usage numbers don’t necessarily equate to broad penetration, given that countries with larger populations would naturally rank higher.
Brazil ranks among the largest users of Claude in raw terms, but its score drops to 0.7x when adjusted for workforce size, showing how population size can inflate raw usage totals.
Asia fares well overall, as South Korea ranks among the top adopters per capita at 3.12x. Australia, Canada, and New Zealand occupy other top spots at 3.27x, 3.15x, and 3.11x respectively.
Most of the highest-ranking countries are in North America, Europe, Oceania, and parts of East Asia.
Malta and Georgia also made the top 20, with scores of 2.8x and 2.17x. Malta consistently punches above its weight as a European startup hub, despite being a tiny island in the Mediterranean, while efforts are underway to institutionalize AI use in Georgia.
At the bottom of the index were Tanzania and Angola, at 0.03x and 0.05x respectively.
Some smaller countries were not included due to an insufficient number of conversations over the observation period.
Uses For AI Vary
Claude usage also varies depending on economic conditions. In lower-income countries, the chatbot is commonly used for homework help and programming tasks, while wealthier countries show a broader mix of professional uses.
The dynamic could also reflect the ages of those using chatbots in different countries. In lower-income areas, there may be higher uptake among students.
To learn more about how AI, check out this graphic which charts the rise of AI chatbots.
Tyler Durden
Tue, 03/17/2026 – 04:15