


Mapping Global Trade With New High-Frequency Data
The global economy is showing resilience despite a sharp rise in U.S. tariffs and growing uncertainty over the future of the international trading system. To provide the most up-to-date snapshot, a Goldman team led by Patrick Creuset introduced clients to a new high-frequency dataset on global trade on Thursday. The global dataset highlights continued economic momentum outside the U.S., even as U.S. trade barriers weigh on imports.
Creuset explained that the new dataset is built on IMF Portwatch and UN Global Platform data, sourcing satellite data of 90,000 commercial vessels and generating more than 25,000 datapoints each week. With about a one-week lag, it provides a near-real-time view of global container flows.
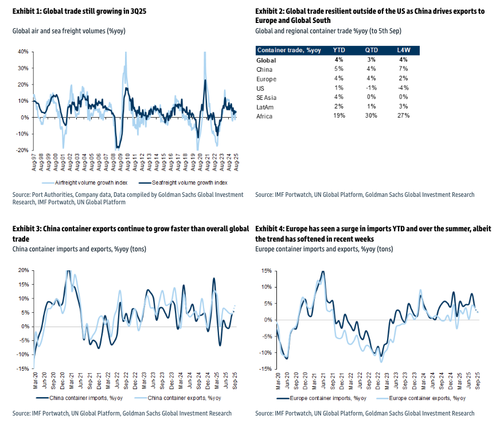
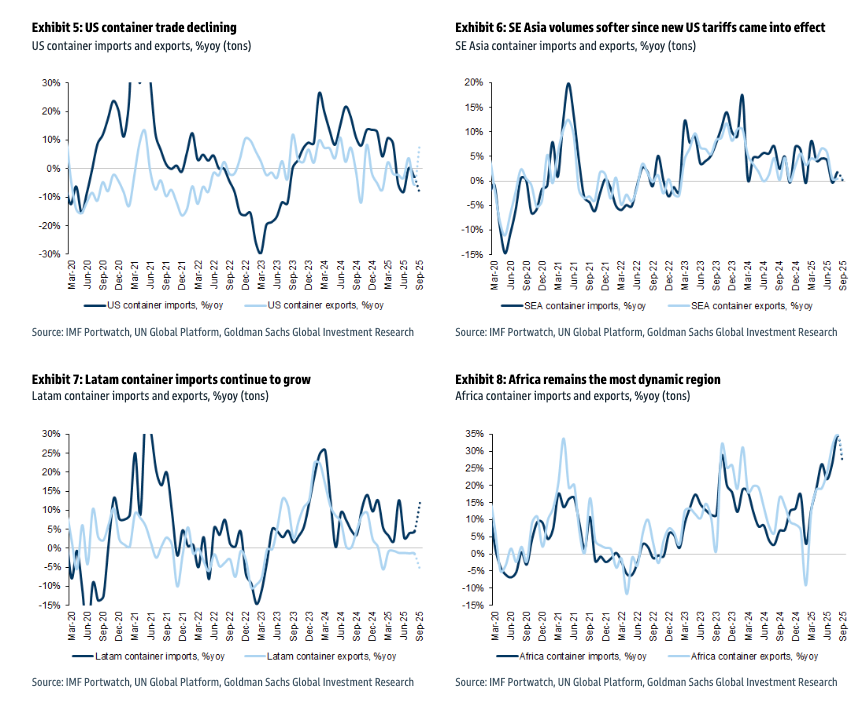
Global trade growth has slowed to 3% year-over-year in the third quarter, down from 4% year-to-date, but remains resilient outside the U.S., where volumes declined in August. Much of China’s strength is situated in its manufacturing industry, with exports up 5% compared to a 4% increase globally. Flows are increasingly directed toward emerging markets in Latin America and Africa, while Europe is importing more from China and exporting less back. A stronger euro against the yuan supports this.
Charts 1 through 8 provide a near-real-time snapshot of the global economy.
Global freight markets in the second half of 2025:
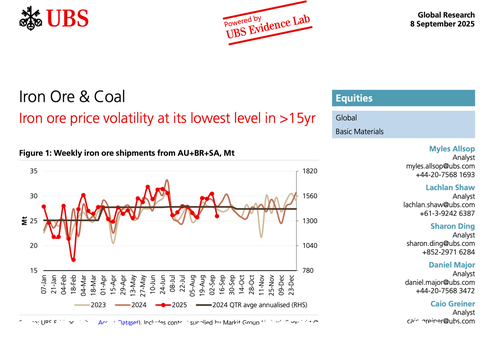
Ocean: We see Q3 growth tracking 3% so far, with a positive skew to Asia-Europe and North-South trades. U.S. exposures will likely underperform, and we would expect U.S. trade to continue to soften into year-end given frontloading/inventory trends. Planned USTR service fees targeting Chinese-built fleets (Oct) could add a further layer of import costs and complexity. Container rates are likely to keep sliding into year-end given slowing demand, rising supply plus adverse seasonal factors.
Air: Has been slightly more resilient than we had anticipated going into the quarter, +3%yoy QTD (Aug) with broadly stable rates (we took our DSV Air numbers up marginally last week), possibly reflecting greater capacity discipline vs. Ocean coupled with robust Tech shipment demand. We still expect the market to soften into Q4 given well-stocked inventories, ocean overcapacity, and the end of the U.S.’ global de minimis exemptions as of 29 Aug.
Road (Europe): Sequentially firmer, with German truck traffic +0.4%yoy QTD (Aug) after uninterrupted declines since early-22. As German infrastructure and defense-focused stimulus gets underway, Q3 25 could mark a positive cyclical inflection point.
This suggests that the popular Democratic narrative – repeated like a broken record on MSM such as CNN and MSNBC – that Trump’s tariffs would wreck the global economy has, so far, been proven wrong. The data show no signs of impending doom or collapse, marking yet another major setback for the left’s ability to hold a narrative for more than a day.
The note, titled “Mapping Global Trade Close(r) to Real Time,” contains more than 80 charts. We’ve covered only about 10% of the charts in this note. The remaining ones can be viewed by ZeroHedge Pro subscribers here.
Tyler Durden
Fri, 09/12/2025 – 06:55