


Mapping Poverty Rates Across America
America’s economic landscape looks very different depending on where you live.
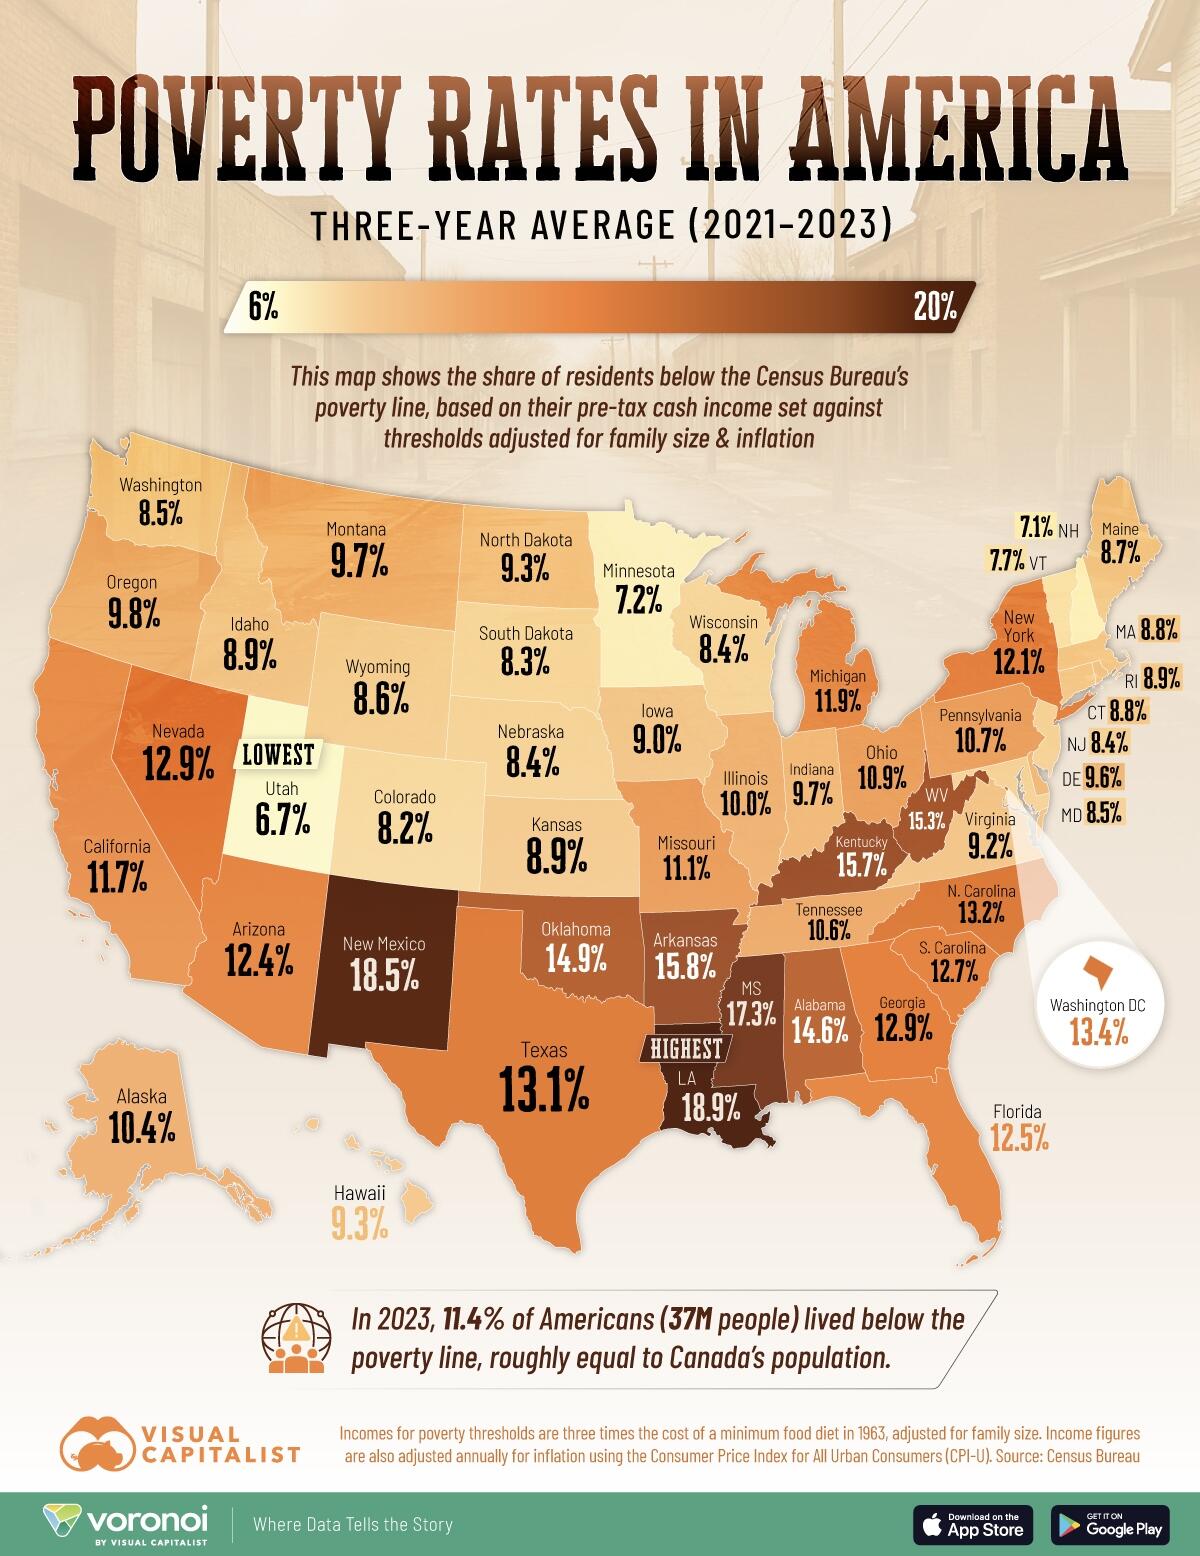
This map of U.S. poverty rates by state, via Visual Capitalist’s Pallavi Rao, makes that disparity clearer.
Each shade represents the share of residents living below the poverty line, inviting quick comparisons across the country.
The data for this visualization comes from the U.S. Census Bureau.
The U.S. Census Bureau calculates poverty lines using pretax household income against a threshold at three times the cost of a minimum food diet from 1963, adjusted for family size and inflation.
For reference, this is a quick guide on how much a household needs to be earning to be considered below the poverty line in 2023.
One person: ≤$15,480
Two people: ≤$19,680
Three people: ≤$24,230
Four people: ≤$31,200
Ranked: U.S. Poverty Rates by State
Louisiana tops the list at 18.9%, leaving nearly one in five residents below the poverty threshold despite the state’s large energy sector.
RankStateState CodeShare of Population
in Poverty# in Poverty
1LouisianaLA18.9%853K
2New MexicoNM18.5%388K
3MississippiMS17.3%501K
4ArkansasAR15.8%473K
5KentuckyKY15.7%699K
6West VirginiaWV15.3%268K
7OklahomaOK14.9%589K
8AlabamaAL14.6%727K
9District of ColumbiaDC13.4%88K
10North CarolinaNC13.2%1.4M
11TexasTX13.1%3.9M
12GeorgiaGA12.9%1.4M
13NevadaNV12.9%409K
14South CarolinaSC12.7%673K
15FloridaFL12.5%2.8M
16ArizonaAZ12.4%903K
17New YorkNY12.1%2.3M
18MichiganMI11.9%1.2M
19CaliforniaCA11.7%4.5M
20MissouriMO11.1%675K
21OhioOH10.9%1.3M
22PennsylvaniaPA10.7%1.4M
23TennesseeTN10.6%744K
24AlaskaAK10.4%74K
25IllinoisIL10%1.2M
26OregonOR9.8%415K
27IndianaIN9.7%659K
28MontanaMT9.7%109K
29DelawareDE9.6%98K
30HawaiiHI9.3%133K
31North DakotaND9.3%72K
32VirginiaVA9.2%783K
33IowaIA9%287K
34IdahoID8.9%172K
35KansasKS8.9%255K
36Rhode IslandRI8.9%96K
37ConnecticutCT8.8%318K
38MassachusettsMA8.8%604K
39MaineME8.7%120K
40WyomingWY8.6%49K
41MarylandMD8.5%524K
42WashingtonWA8.5%658K
43NebraskaNE8.4%165K
44New JerseyNJ8.4%776K
45WisconsinWI8.4%490K
46South DakotaSD8.3%74K
47ColoradoCO8.2%473K
48VermontVT7.7%49K
49MinnesotaMN7.2%409K
50New HampshireNH7.1%98K
51UtahUT6.7%226K
N/AU.S.US11.4%37.6M
Neighboring Mississippi (17.3%) and Arkansas (15.8%) tell a similar story of limited job diversity and chronically low household incomes.
In fact, a contiguous belt stretching from Louisiana and Mississippi through Arkansas and up to West Virginia contains every state with poverty rates above 15%.
Historic underinvestment, weaker safety-net programs, and lower average wages all help explain why the South accounts for four of the five worst-affected states.
Northern and Plains States See the Lowest Poverty Shares
In stark contrast, Utah (6.7%), New Hampshire (7.1%), Minnesota (7.2%), and Colorado (8.2%) post some of the lowest poverty figures in the country.
These states benefit from stronger labor markets, higher median wages, and broader access to education and healthcare.
Even populous Midwestern states like Illinois and Wisconsin keep poverty near or below 10%, underscoring how economic structure and public policy can insulate households from hardship.
Geography, then, is a reliable—if imperfect—proxy for opportunity in today’s America.
Population Size Skews the National Picture
Looking only at rates can mask the human scale of poverty.
California’s poverty rate sits near the national average at 11.7%, yet its sheer population means 4.5 million Californians live in poverty.
Texas tells a similar story: its 13.1% rate translates into 3.9 million people, the second-largest total nationwide.
Altogether, the U.S. counted 37.6 million residents in poverty during in 2023, almost the size of Canada’s entire population
If you enjoyed today’s post, check out Mapped: Average Salary by State in 2025 on Voronoi, the new app from Visual Capitalist.
Tyler Durden
Sun, 08/24/2025 – 18:05