


March Jobs Shocker: Payrolls Soar By 178K Most Since 2024, Blowing Away All Estimates; Unemployment Rate Drops
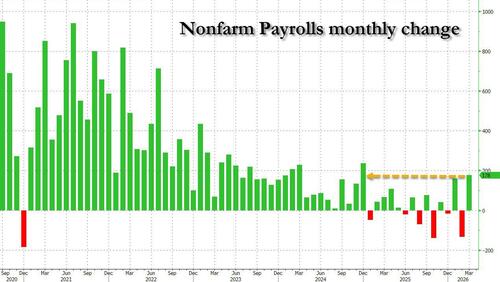
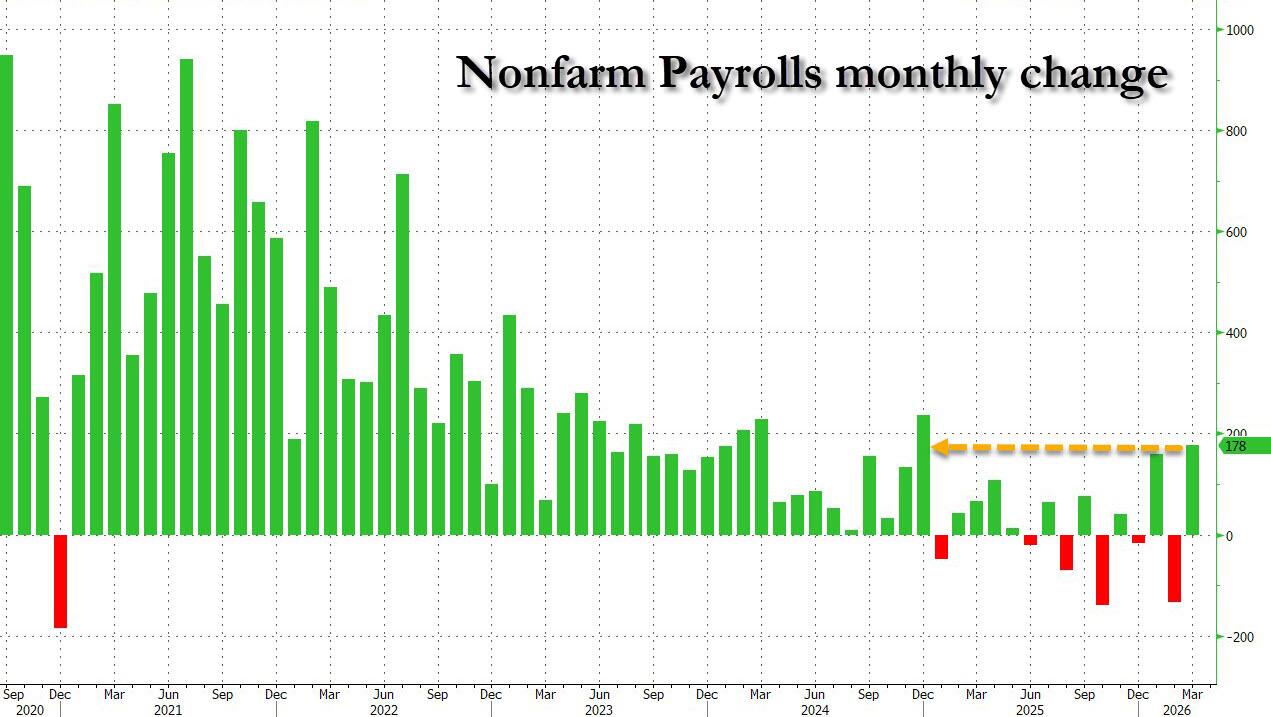
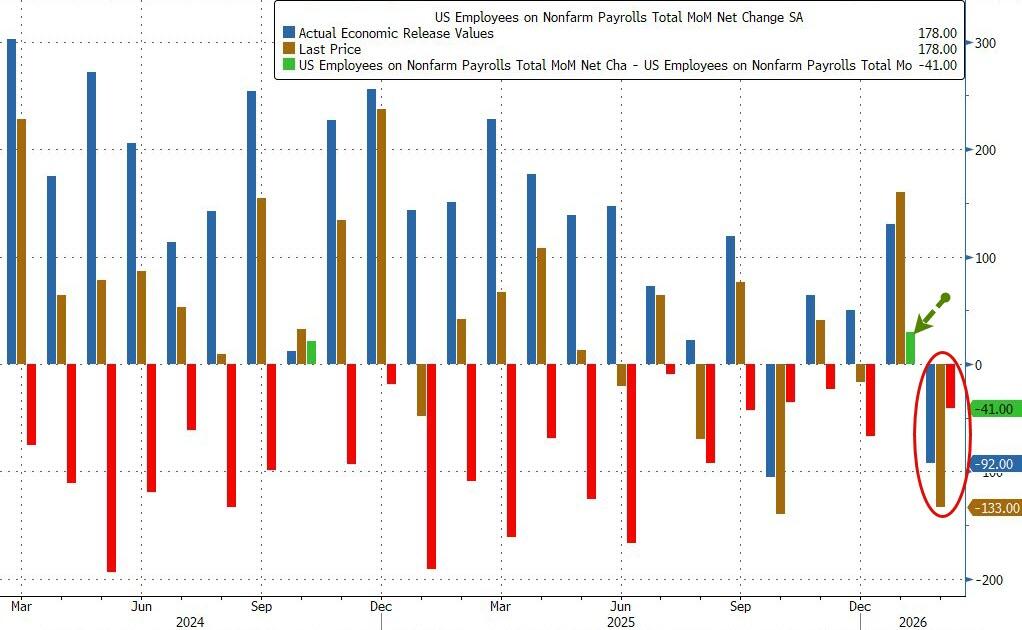
We titled our nonfarm payroll preview post “a substantial bounce” and boy were we right: with consensus expecting a material rebound from February’s negative print (which was revised as usual worse, from -92K to -133K), what the BLS reported instead was a huge beat to expectations of a 65K increase, with March jobs reportedly rising by 178K, the biggest increase since December 2024.
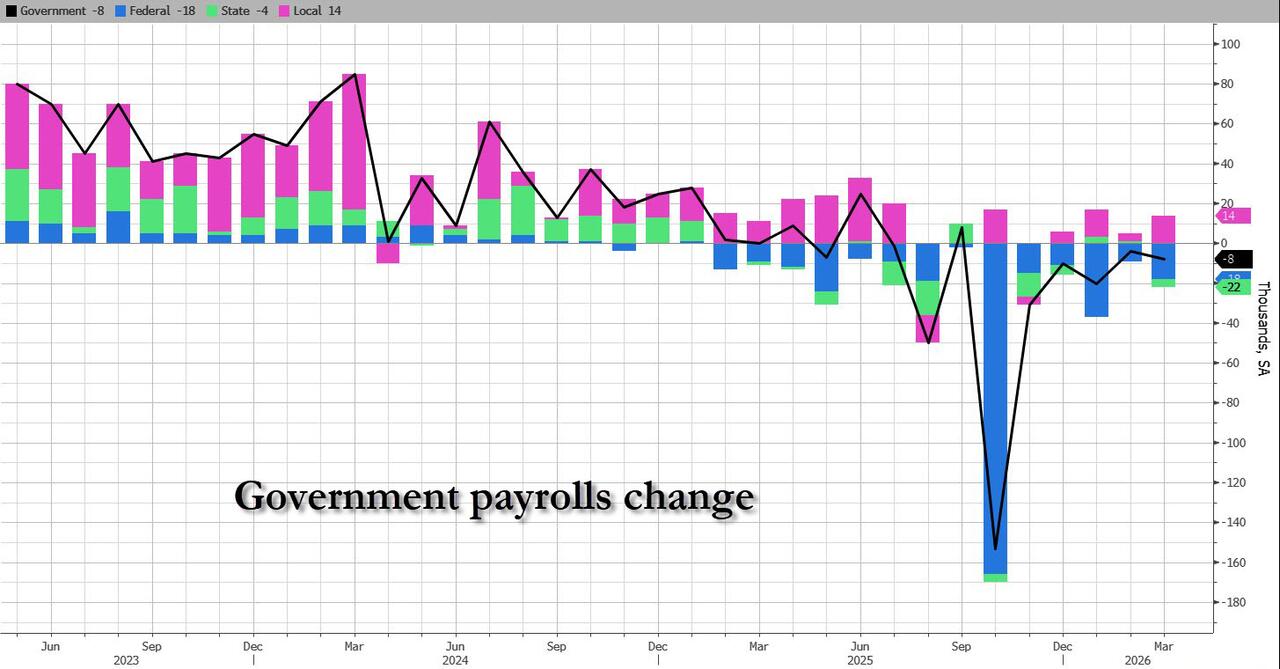
The number was driven entirely by a surge in private workers which added 186K in March, far above estimates of 78K. Government workers continued to drop, sliding by 8K in March and now negative 8 of the past 9 months,
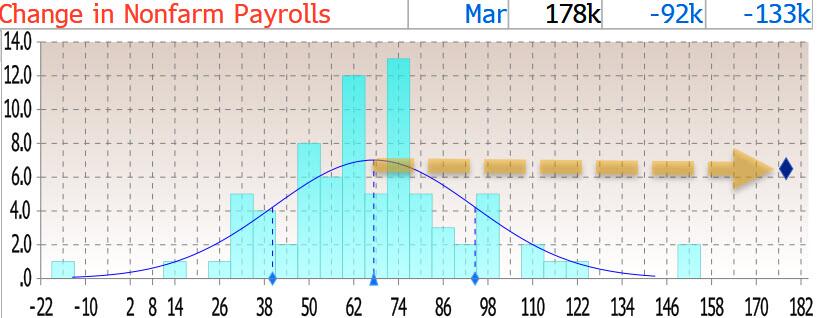
This was not only higher than all estimates but was a 3 sigma beat to the median forecast, something we haven’t seen in over a year.
In keeping with tradition, the previous month’s data was revised sharply negative, from -92K to -133K, despite expectations of an upward revision. Yet for once there was an upward revision in the historical data: the change in total nonfarm payroll employment for January was revised up by 34,000, from +126,000 to +160,000, and the change for February was revised down by 41,000, from -92,000 to -133,000. With these revisions, employment in January and February combined is 7,000 lower than previously reported. (Monthly revisions result from additional reports received from businesses and government
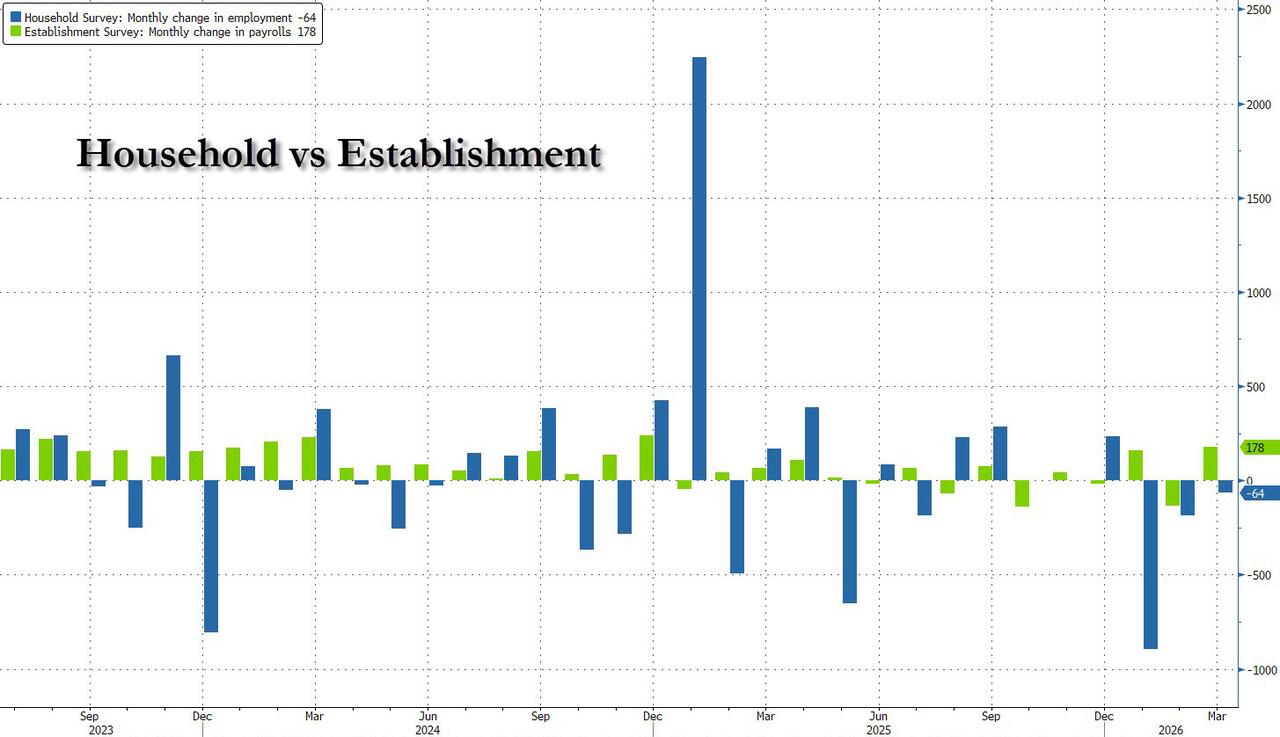
A quick look at the Household survey shows that while the establishment survey posted a solid increase of 178K, the Household increase declined again, dropping by 64K, the 3rd month in a row.
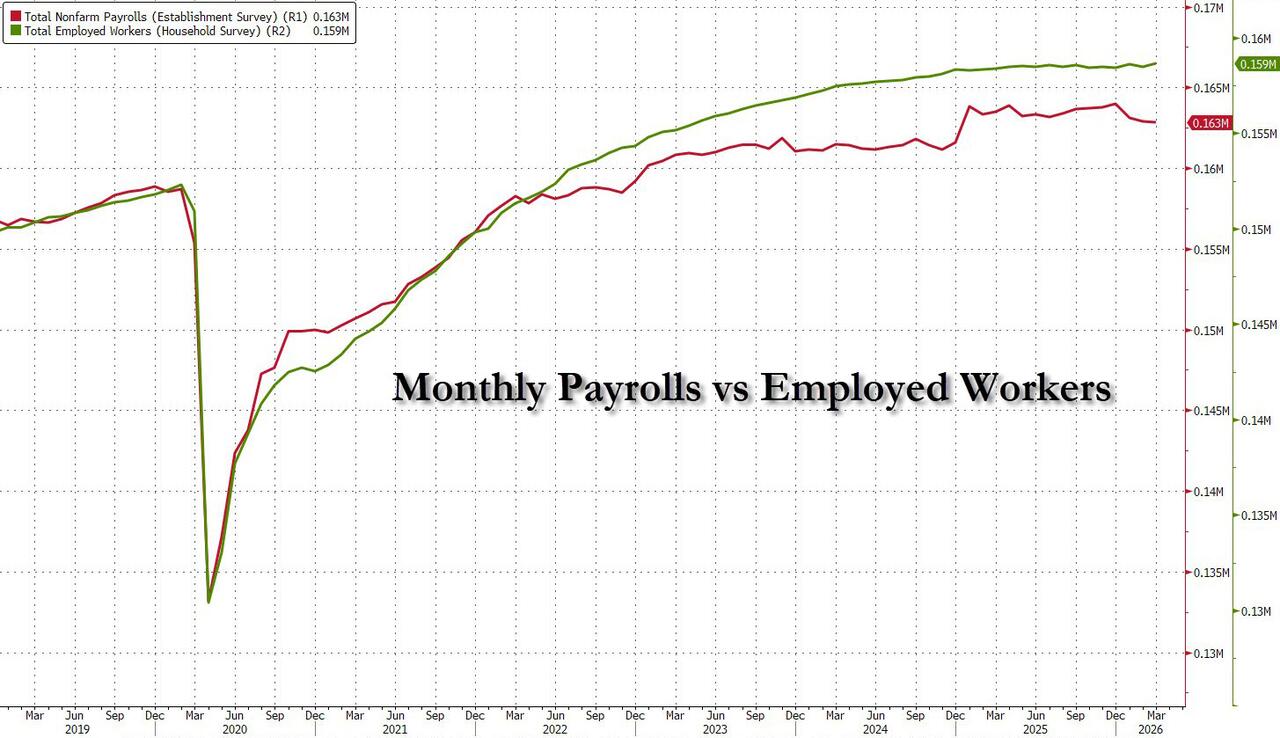
This means that despite all attempt to revise away the impact of illegal immigration, it still lingers with total number of payrolls (Establishment) running well ahead of employed workers (Household).
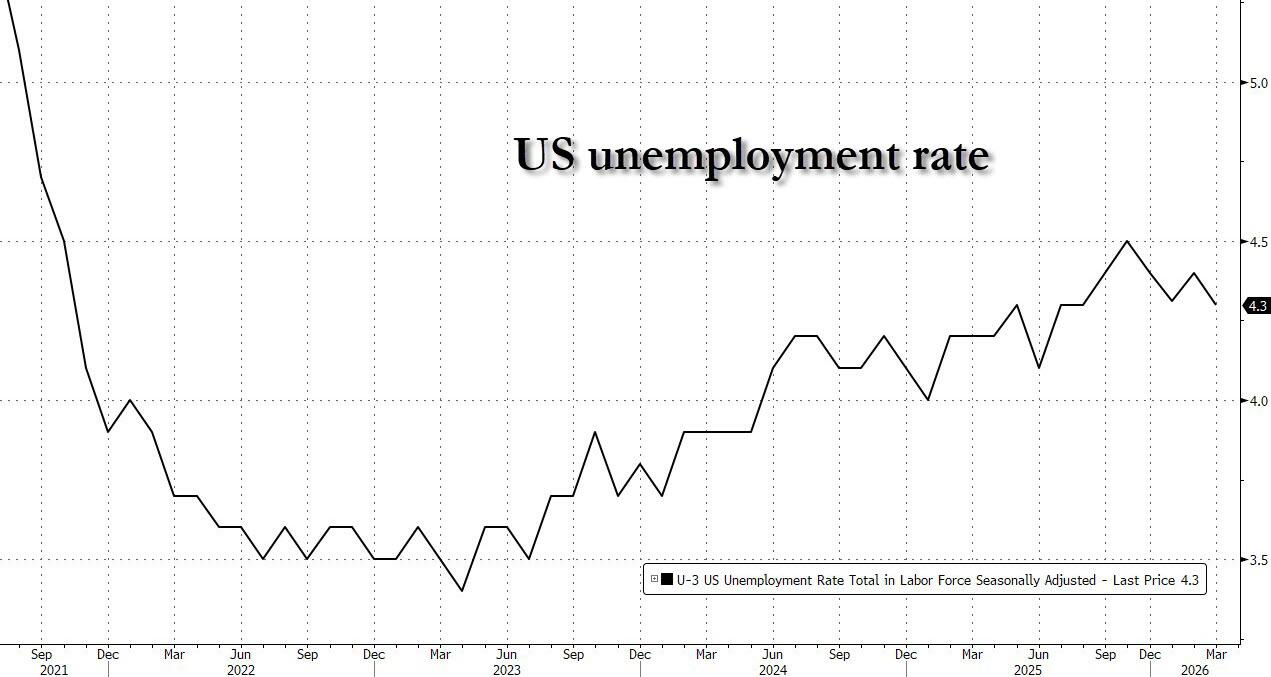
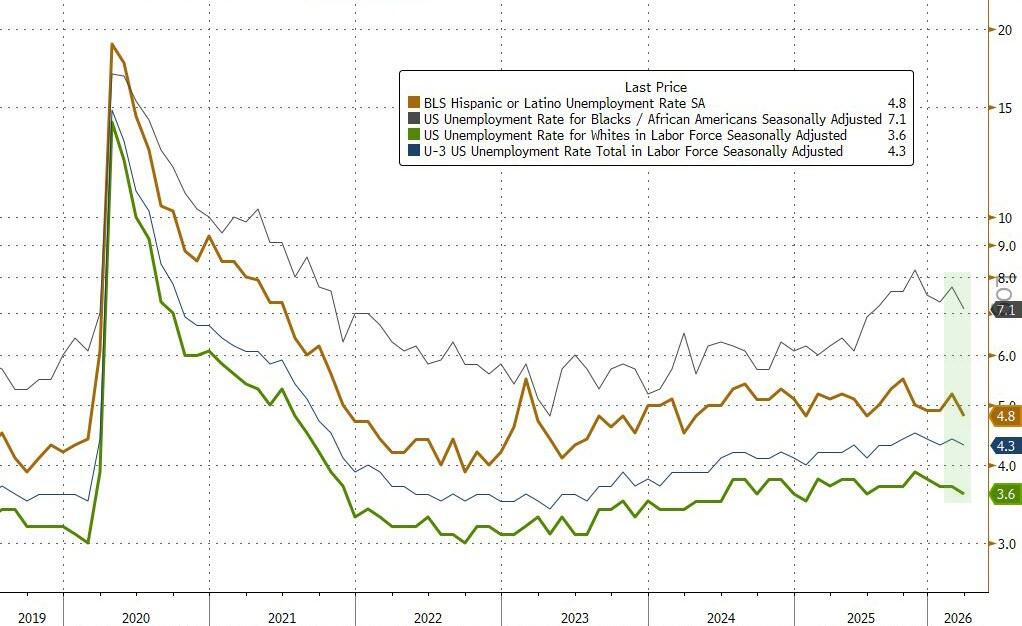
There was more good news: the unemployment rate actually dropped from 4.4% to 4.3% amid expectations of an unchanged print. This was despite a drop in the actual number of employed workers (per the Household survey) but offset by an even bigger drop in the civilian labor force, which declined by almost 400K, from 170.483MM to 170.087MM.
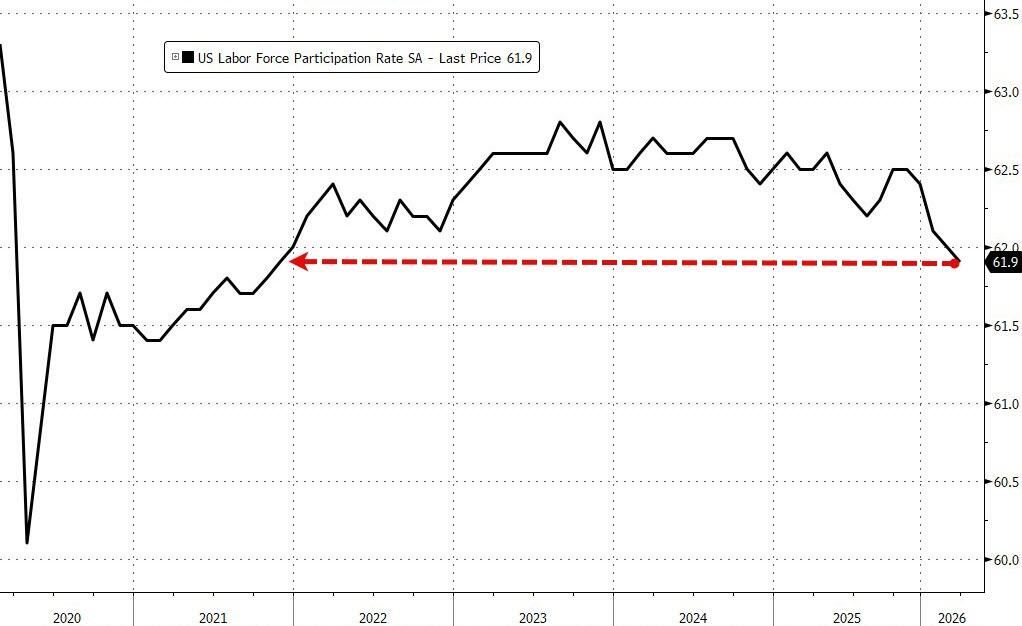
While the unemployment rate dropped, the labor force participation rate slumped to a 5 year low, largely due to the halt of illegal immigration, helping keep unemployment depressed.
Among the major worker groups, the unemployment rate for people who are Asian (3.7%) decreased in March. The jobless rates for adult men (3.8%), adult women (4.0%), teenagers (13.7%), and people who are White (3.6%), Black (7.1%), or Hispanic (4.8%) all posted a modest sequential drop.
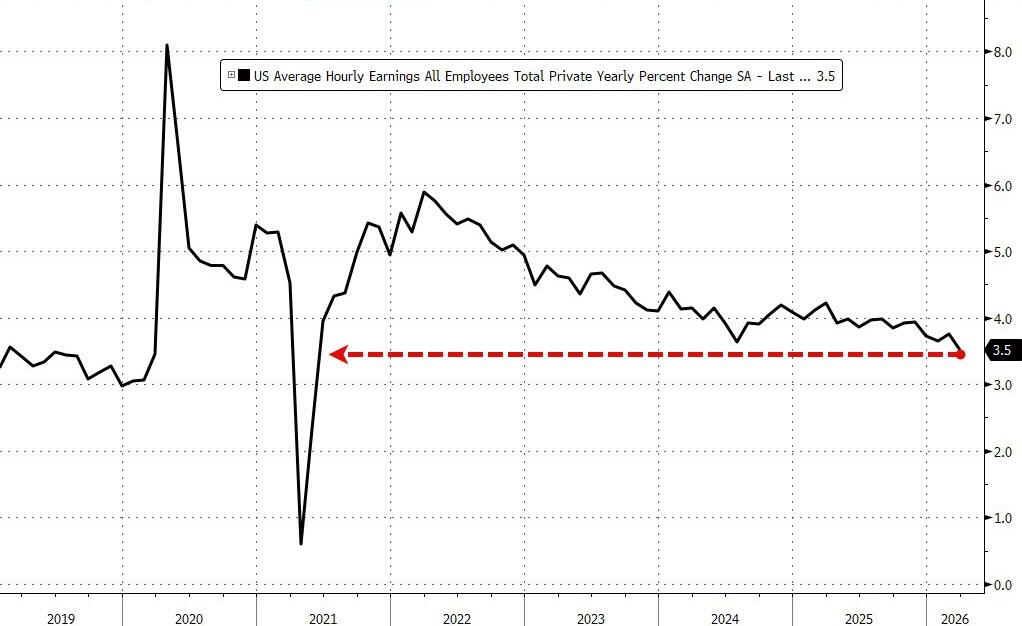
There was some good news for the Fed too, with a 0.2% increase in monthly average hourly earnings, below the 0.3% est and down from 0.4% in February, the annual increase in hourly earnings was just 3.5%, the lowest in 3 years, and below estimates of a 3.7% increase. It appears that the most important metric for the Fed – hourly earnings – is starting to take on water.
A few additional highlights from the report:
The number of long-term unemployed (those jobless for 27 weeks or more) changed little at 1.8 million in March but is up by 322,000 over the year. The long-term unemployed accounted for 25.4 percent of all unemployed people in March.
Both the labor force participation rate, at 61.9 percent, and the employment-population ratio, at 59.2 percent, both at multiyear lows
The number of people employed part time for economic reasons, at 4.5 million, changed little in March. These individuals would have preferred full-time employment but were working part time because their hours had been reduced or they were unable to find full-time jobs.
The number of people not in the labor force who currently want a job changed little at 6.0 million in March. These individuals were not counted as unemployed because they were not actively looking for work during the 4 weeks preceding the survey or were unavailable to take a job.
Among those not in the labor force who wanted a job, the number of people marginally attached to the labor force increased by 325,000 in March to 1.9 million. These individuals wanted and were available for work and had looked for a job sometime in the prior 12 months but had not looked for work in the 4 weeks preceding the survey.
The number of discouraged workers, a subset of the marginally attached who believed that no jobs were available for them, increased by 144,000 in March to 510,000.
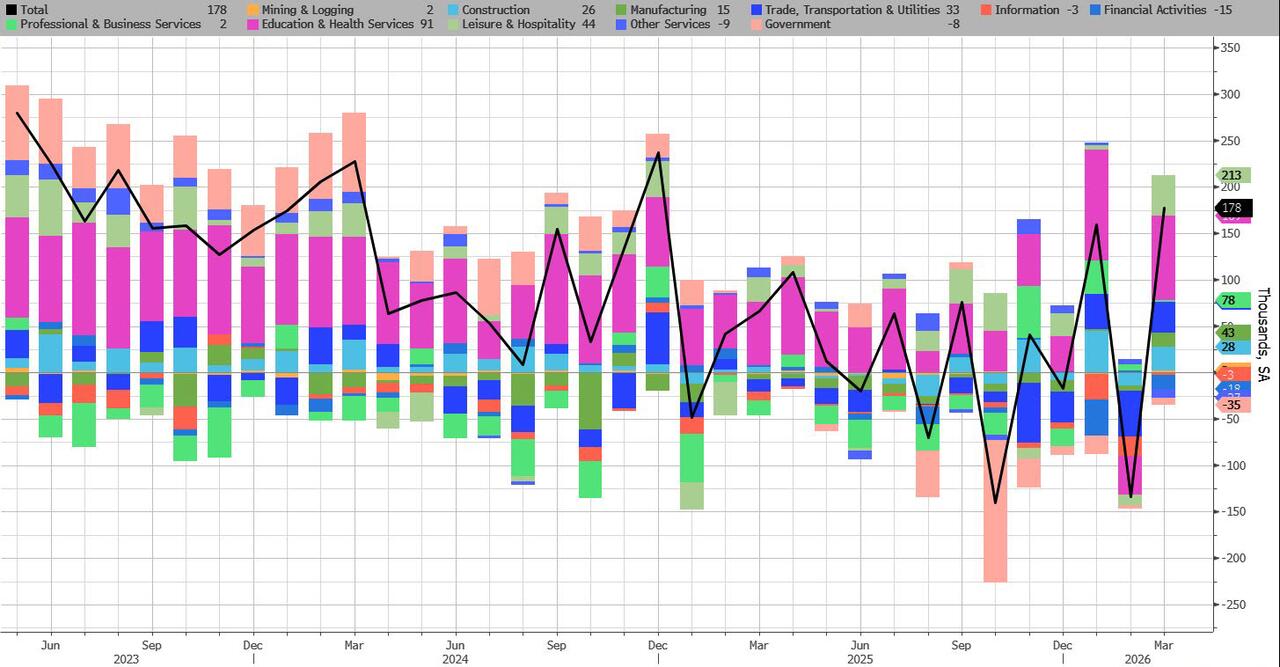
Taking a closer look at the Establishment survey, in March job gains occurred in health care, in construction, and in transportation and warehousing. Federal government employment continued to decline.
Health care added 76,000 jobs in March. Employment in ambulatory health care services rose by 54,000, reflecting an increase of 35,000 in offices of physicians as workers returned from a strike. Employment also increased in hospitals (+15,000). Over the prior 12 months, health care had added an average of 29,000 jobs per month.
Employment in construction grew by 26,000 in March but had shown little net change over the prior 12 months.
Transportation and warehousing added 21,000 jobs, reflecting a gain in couriers and messengers (+20,000). Employment in transportation and warehousing is down by 139,000 since reaching a peak in February 2025.
Employment in social assistance continued its upward trend in March (+14,000), primarily in individual and family services (+11,000).
Federal government employment continued to decline in March (-18,000). Since reaching a peak in October 2024, federal government employment is down by 355,000, or 11.8 percent. Federal employees on furlough during the partial government shutdown were counted as employed in the establishment survey because they worked or received (or will receive) pay for the pay period that included the 12th of the month.
Employment in financial activities edged down by 15,000 in March, reflecting a loss in finance and insurance (-16,000). Employment in financial activities is down by 77,000 since reaching a peak in May 2025.
Employment showed little change over the month in other major industries, including mining, quarrying, and oil and gas extraction; manufacturing; wholesale trade; retail trade; information; professional and business services; leisure and hospitality; and other services.
As noted above, the best news was that government workers dropped again, now for the 6th straight month and 8 of the past 9.
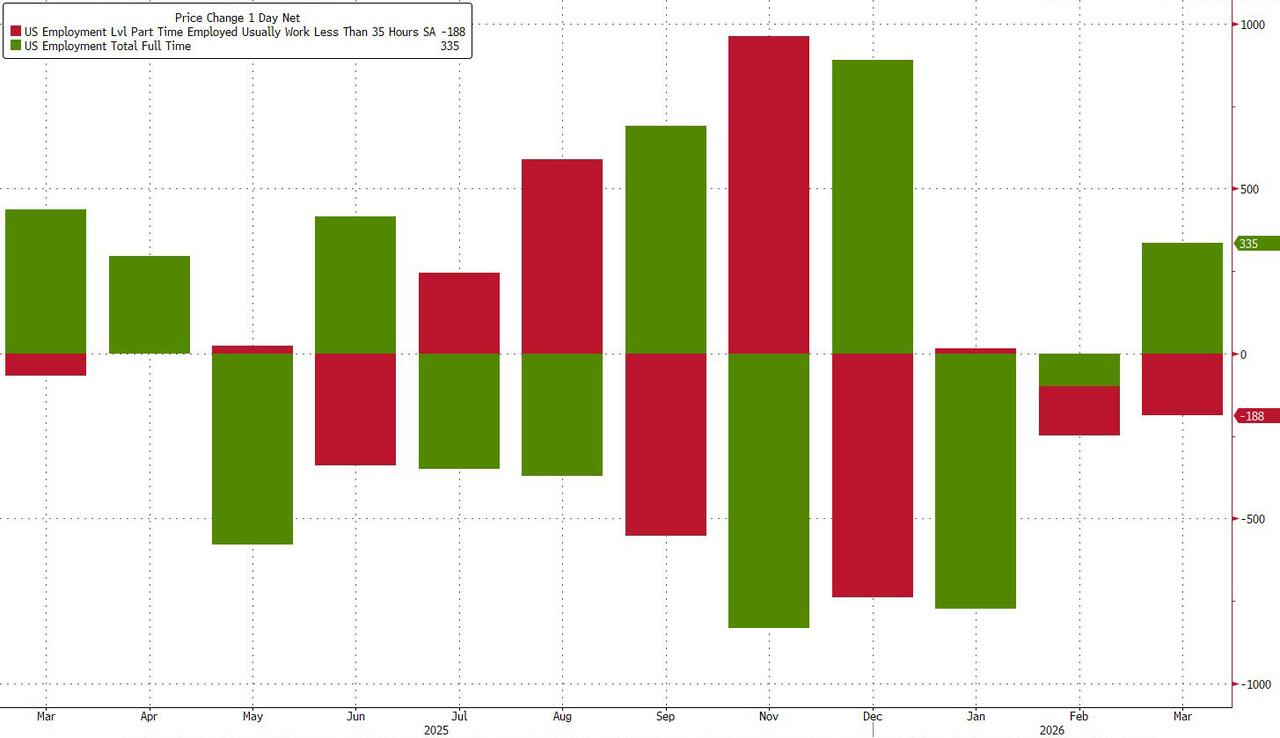
Peeking below the surface of this month’s report, we find that the quality distribution was solid, with +335K full-time jobs added, offset by a 188K drop in part-time jobs.
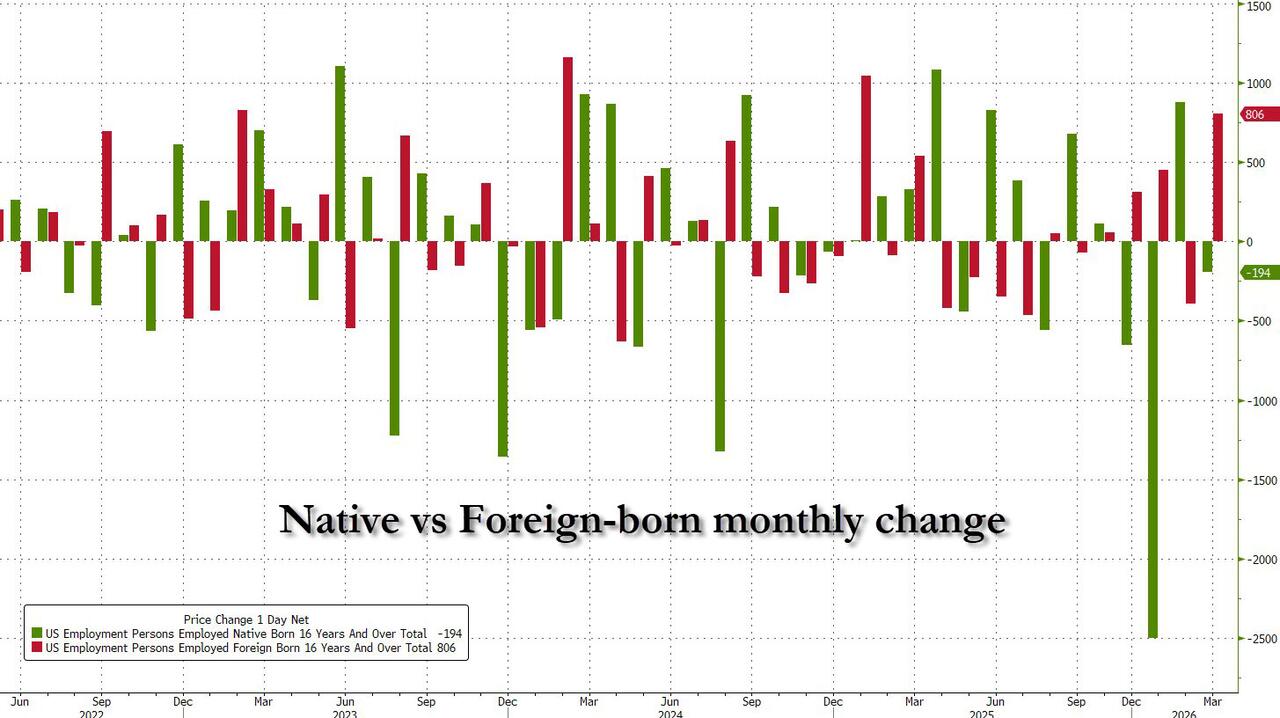
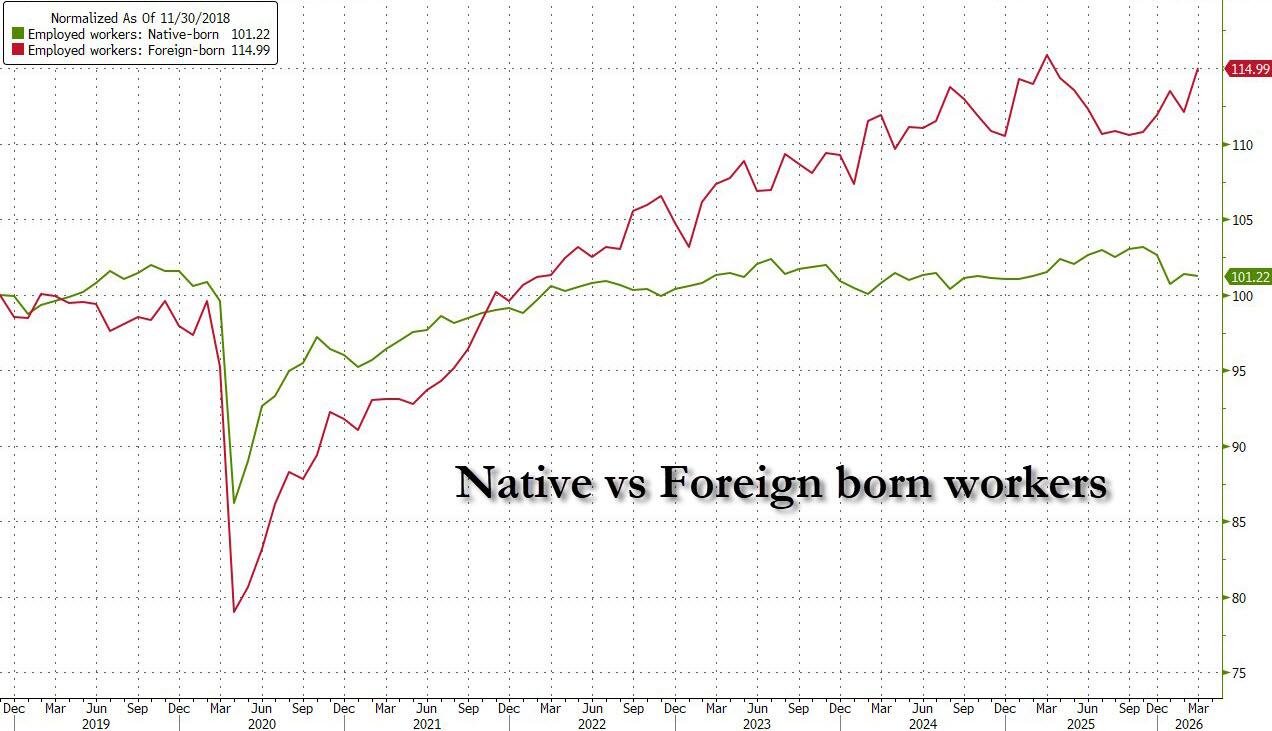
Last but not least, one of the most closely watched series, that of native vs foreign-born (mostly illegal) workers showed the biggest monthly increase in foreign-born workers since January 2025, which suggests that the strength in today’s jobs report may have been derived from the one thing that Trump has been eager to do away with: illegal labor.
Tyler Durden
Fri, 04/03/2026 – 08:51