


Market Lesson: Why Panic Is A Costly Mistake
Authored by Lance Roberts via RealInvestmentAdvice.com,
The Iran shock erased 18% from valuations and fully recovered in two weeks. Investors who panicked missed it all. Here’s what the market lesson is about: risk management, behavior, and what to do with your portfolio right now.
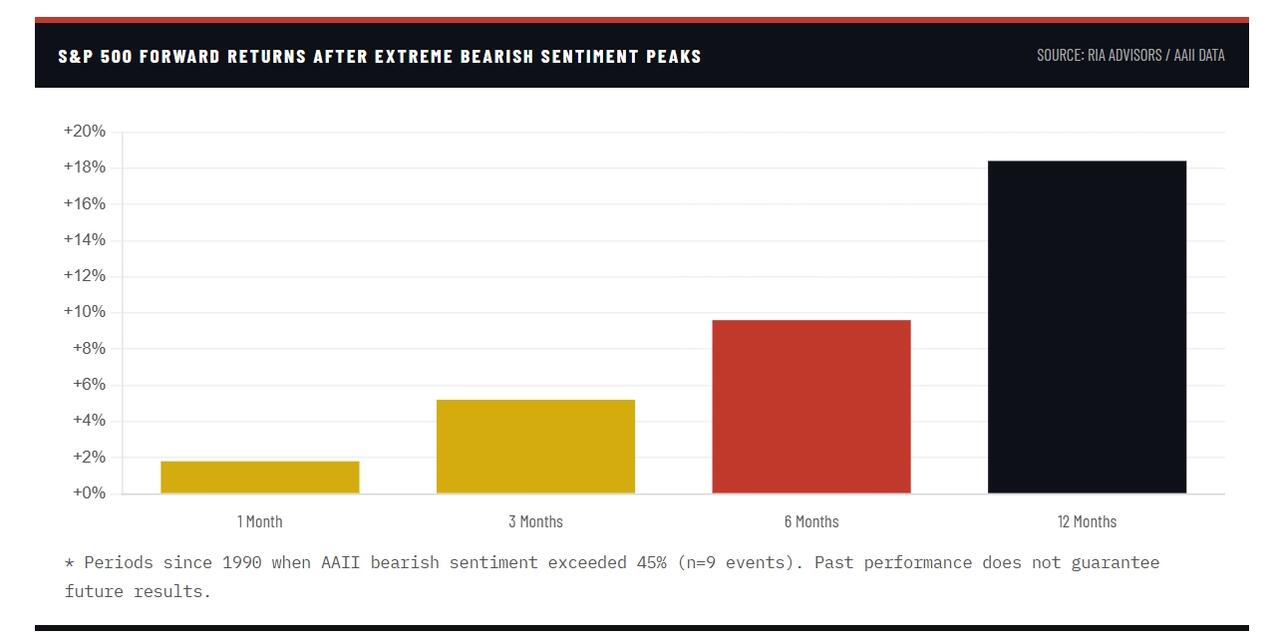
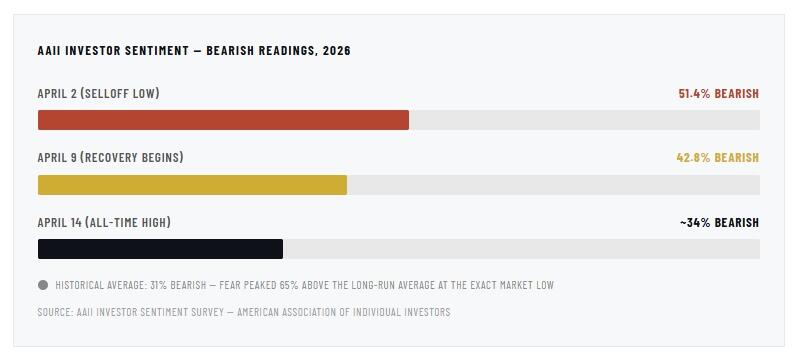
The stock market selloff between February 28 and April 14 produced one of the more instructive market lessons in recent memory. It isn’t because of what the market did, but because of what investors did in response. By April 2nd, the AAII Sentiment Survey showed bearish sentiment at 51.4%, the highest reading in years, well above the historical average of 31%. Put option volume surged, and the financial media ran daily coverage of worst-case oil scenarios, recession projections, and S&P 500 targets as low as 3,800.
However, when you have that combination of bearishness, as we discussed in 5-Consecutive Weekly Declines, markets tend to perform better.
What was surprising was that the S&P 500 recovered completely in two weeks and is now setting all-time highs.
That sequence is not a reason to relax, but it is a valuable market lesson. It is also a good reason to examine what happened to investors who panicked, why the pattern repeats with such regularity, and, most importantly, what a well-constructed portfolio actually looks like when the next stock market selloff arrives. Because it will arrive. The only uncertainty is the catalyst.
The Drill & The Failure
Every major market shock is a test, a market lesson to be learned from. Not a test of whether your thesis was right, or whether you picked the right stocks. A test of whether your portfolio was built to hold under pressure, and whether your instincts are an asset or a liability when it counts.
The Iran conflict delivered a real economic shock. U.S. and Israeli forces struck Iran’s nuclear facilities. Tehran retaliated against Gulf energy infrastructure and the Strait of Hormuz, the narrow waterway through which roughly 20% of the world’s oil supply flows daily, ground to a halt. Brent crude surged from $61 at year-end to over $114 a barrel, and that spike raised inflation expectations, hammered small caps, and sent Asian equity markets into a tailspin as energy costs threatened to consume the profit margins underpinning the region’s AI and manufacturing boom.
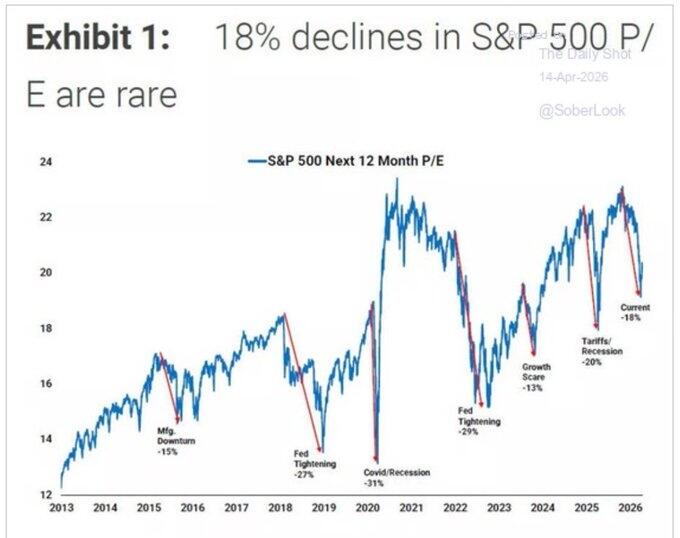
Then, at what seemed to be the darkest moment, the market repriced all of that in two weeks. Valuations declined roughly 18% as investors adjusted for the expected impact of higher oil prices on earnings and consumer spending. That repricing was rational, but the panic layered on top of it was not. In the middle of the selloff, predictions of a structural bear market were everywhere, but none of them materialized.
That pattern of maximum fear at the exact moment prices are lowest, followed by regret as they recover, is a market lesson that repeats itself regularly. The investors who liquidated near the recent lows, as sentiment turned negative, locked in losses. But two weeks later, they face an even more difficult decision: do I reenter at prices 10% higher than the ones I sold at? Most don’t. That gap between market returns and the average investor’s actual earnings is the most expensive line item in the typical portfolio.
What Risk Is, And Isn’t
The word “risk” gets used so loosely in financial media that it has lost most of its meaning. A falling stock price isn’t the definition of “risk.” Neither is a scary headline. Volatility isn’t risk either; it’s the price of admission for participating in markets over time.
As I’ve said previously, if you aren’t willing to watch your portfolio decline 10% to 15% without doing something rash, you aren’t really an investor; you are a speculator who happens to be holding stocks.
Risk, defined precisely, is the probability of a permanent impairment of capital. Not temporary losses, or a 10% drawdown that reverses in two weeks. Risk is the permanent impairment of capital, resulting in significantly diminished future outcomes. The distinction is enormous, separating investors who compound wealth over decades from those who don’t.
When the S&P 500 dropped during the Iran shock, the vast majority of that decline reflected a temporary repricing of earnings expectations under elevated oil prices. The underlying companies, their cash flows, their competitive advantages, and their earnings power didn’t change materially. The price changed, but the value didn’t. Investors who sold during that repricing didn’t escape risk; they converted a temporary paper loss into a realized one and then forfeited the recovery.
The market lesson is in the chart. Fear peaked at the moment prices were most attractive. By the time the market had recovered and all-time highs were being printed, fear had nearly returned to historical norms. The investors who acted on that peak in fear did exactly the wrong thing at exactly the wrong moment. The investors who recognized it as a contrarian signal, or who simply had the discipline to do nothing, participated in the full recovery.
The Behavior Gap: The Most Expensive Cost
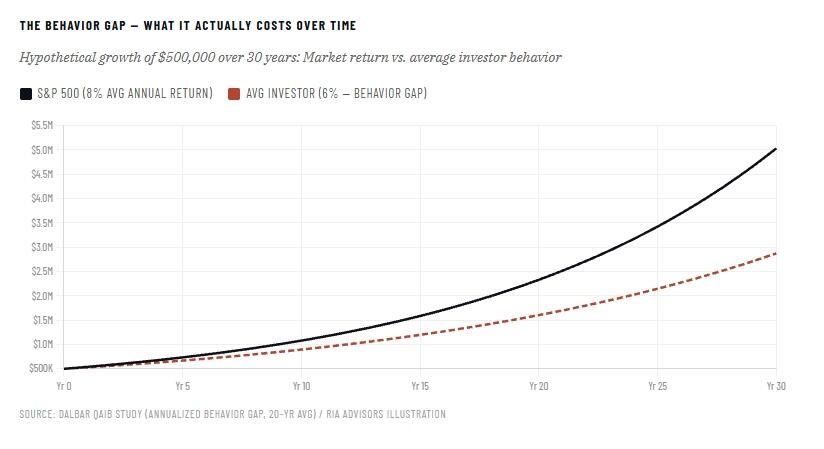
Dalbar Inc. has published an annual study for over 30 years, measuring the difference between the return delivered by the stock market and the return actually earned by the average equity investor. The gap, which Dalbar calls the “behavior gap,” has consistently shown that the average investor earns two to three percentage points less per year than the indices they’re invested in. That shortfall isn’t explained by fees or bad stock selection. It’s explained entirely by timing decisions: buying after rallies and selling during selloffs.
Over 30 years, a two-percentage-point annual shortfall compounds into a staggering wealth gap. A $500,000 portfolio growing at 8% a year becomes roughly $5 million. The same portfolio growing at 6%, because the investor panicked during selloffs and missed recoveries, becomes roughly $2.9 million. That $2.1 million gap is the price of panic. And the investor who sold near the April 2nd sentiment extreme has already paid a portion of it.
After every major market shock, the “this time is different” argument gains traction. The Iran conflict gave that argument real support. It was a genuine exogenous shock with measurable economic consequences, not a technical correction or manufactured volatility. But the historical record on recovery from sharp, shock-driven selloffs is remarkably consistent, and favors the patient investor over the reactive one.
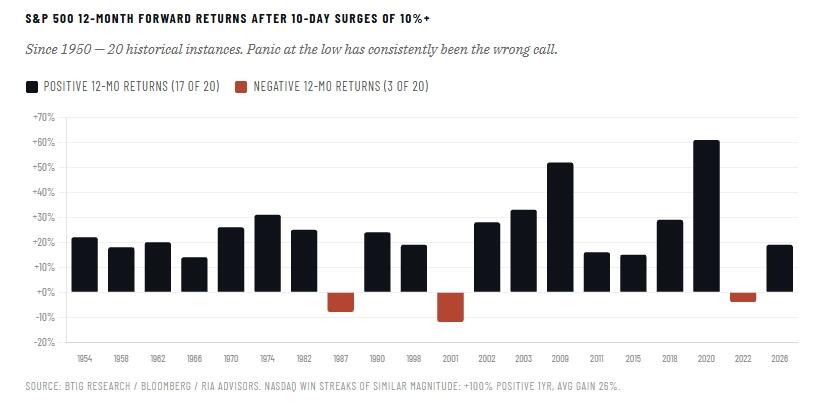
Since 1950, there have been 20 instances in which the S&P 500 rose more than 10% in a 10-day period, the kind of snapback recovery we saw in April. Over the following 12 months, the index was higher in 17 of those 20 cases, with an average gain of 19%. Nasdaq win streaks of comparable magnitude resolved higher 100% of the time over 12 months, with average gains near 26%. Those numbers don’t guarantee another selloff isn’t coming. That means the investors best positioned to capture those forward returns are the ones who stayed disciplined through the downturn. They rebalanced into weakness, and held enough cash to redeploy rather than liquidate.
Consider 2022. The Fed’s tightening cycle produced a 9-month bear market that erased ~25% from the S&P 500. The investors who sold in October 2022, when sentiment was just as dark as it was in early April 2026, missed a recovery that added nearly 60% over the next two years. The pattern repeats because human psychology repeats. The catalyst changes. The behavior doesn’t.
Build a Shock-Resistant Portfolio
Building a portfolio that survives market selloffs without requiring heroic decision-making isn’t complicated. It’s only unpopular because it involves accepting modest underperformance during the easy, low-volatility periods in exchange for not being the person who liquidates at the bottom during the hard ones.
The UBS analysis of the Iran shock made a point worth internalizing. The assets that acted as refuges during 2025’s tariff-driven selloff, such as gold, the Japanese yen, and Treasuries, provided meaningfully less protection this year. The assets that performed well in 2026, particularly the trade-weighted dollar, did little to offset losses during last year’s episode. In other words, building a portfolio to hedge against the last crisis is a losing strategy. The next one will look different.
The more durable approach focuses not on predicting which hedge will work, but on maintaining portfolio construction that allows you to hold through volatility without being forced to sell. That means genuine diversification across asset classes and geographies. It means a real cash buffer that functions as optionality. It also means rebalancing mechanically rather than emotionally, adding exposure when prices are low and trimming when they’ve run ahead of value.
The Iran conflict reframed a question many investors had avoided asking: Were they genuinely diversified? Investors with heavy commodity-linked exposure looked prescient during the decline. But that quickly fell out of favor as megacap technology stocks took center stage during the recovery. Having diversification means you had positions that performed during both the decline and the rally. Concentrated, one-sided portfolios rarely perform well over the long term.
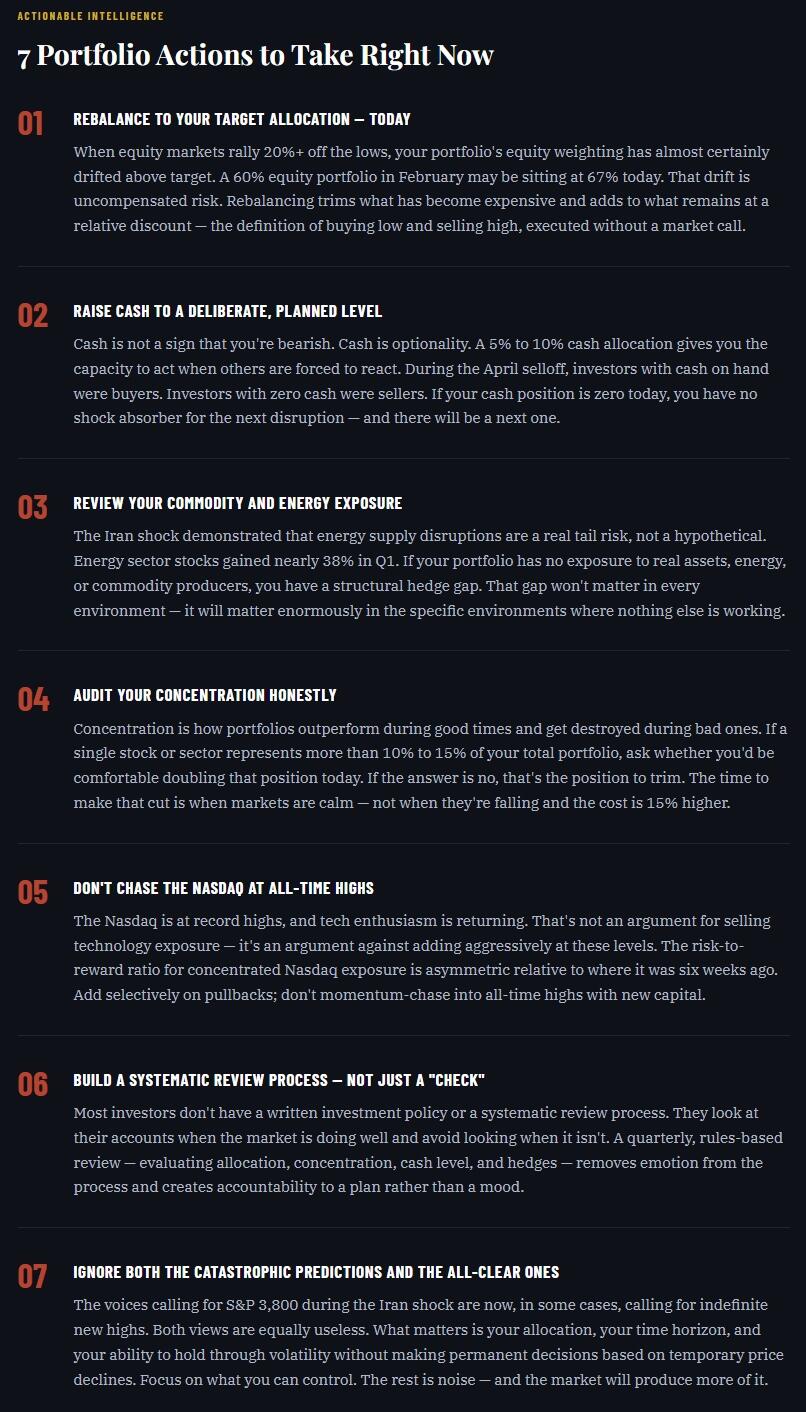
Here are seven portfolio actions to think about today.
The six weeks between late February and mid-April gave every investor a real-world market lesson. That lesson was in both portfolio construction and behavioral discipline. It wasn’t about Iran, oil prices, or the Strait of Hormuz. The lesson was whether your portfolio was built to withstand a genuine shock. And whether you know the difference between a temporary price decline and a permanent impairment of value.
Those who held, rebalanced, and redeployed cash came out ahead. Those who sold near the lows are now deciding what to do with prices ~10% higher. Most won’t. That’s the behavior gap in real time, and it compounds across every market cycle over an investing lifetime.
After 30 years of watching this pattern repeat, I can tell you with confidence that no amount of market forecasting substitutes for a sound process. The S&P 500 is trading at roughly 20 times forward earnings, the ten-year Treasury yield is near 4.3%, and the geopolitical situation is improving, or at least markets are pricing it that way. What comes next is unknowable. What you do with your portfolio in the meantime is entirely within your control.
That’s always been the real market lesson. The Iran shock just delivered it again, free of charge and clearly labeled.
What you do with it is up to you.
Tyler Durden
Mon, 04/20/2026 – 14:20