


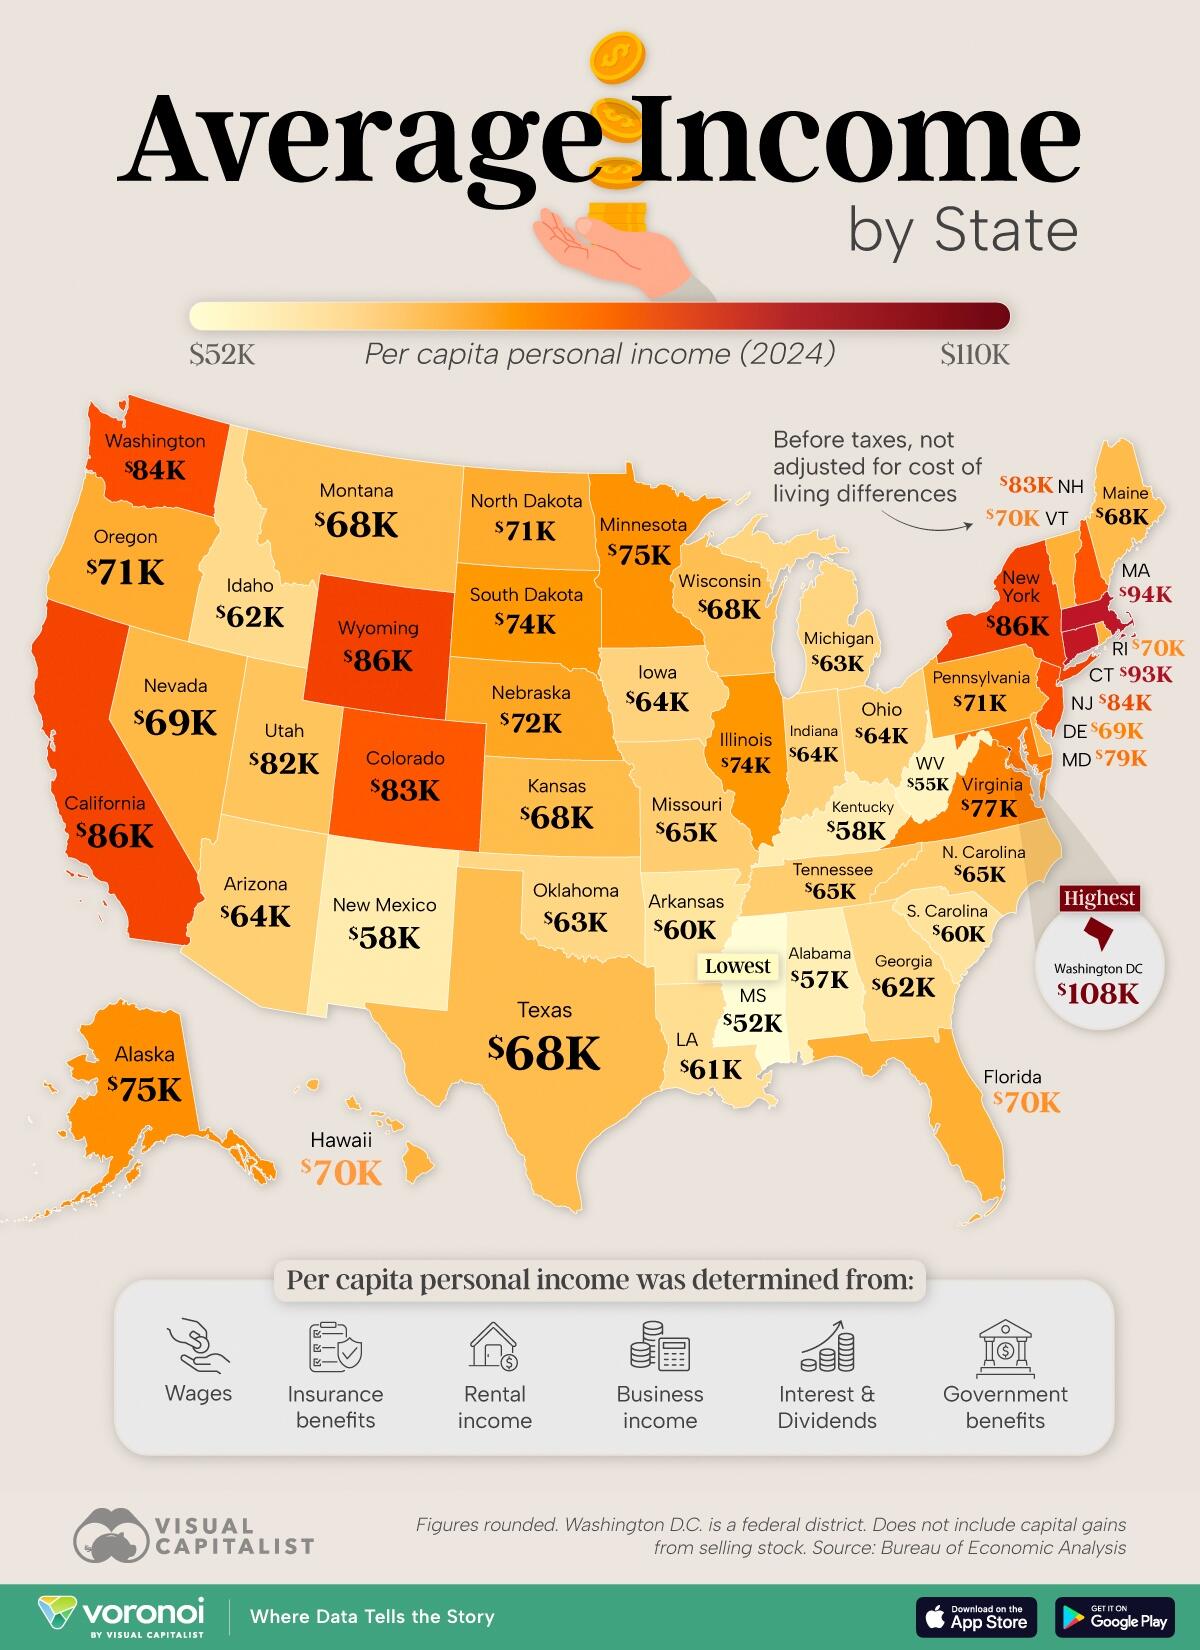
Southern States Have The Lowest Average Incomes, DC The Highest
Personal income levels across the U.S. vary widely, shaped by differences in industries, costs of living, and economic growth.
This map lists states by their per capita personal income, showing where residents, on average, earn the most.
The data, via Visual Capitalist’s Pallavi Rao, for this visualization comes from the U.S. Bureau of Economic Analysis, compiled by StatsAmerica.
These figures include pre-tax earnings from: wages, insurance & government business & rental income, interest, and dividends, unadjusted for living costs.
It does not include capital gains from selling stock.
Ranked: U.S. States With the Highest Income in 2024
Washington, D.C. holds the highest per capita personal income in the nation at $108,233, boosted by a concentration of high-paying government, legal, and consulting jobs.
Rank
State
Code
Per Capita Personal
Income (2024)
1
DC
DC
$108,233
2
Massachusetts
MA
$93,927
3
Connecticut
CT
$93,235
4
Wyoming
WY
$85,945
5
New York
NY
$85,733
6
California
CA
$85,518
7
New Jersey
NJ
$84,071
8
Washington
WA
$83,938
9
New Hampshire
NH
$82,878
10
Colorado
CO
$82,705
11
Maryland
MD
$78,538
12
Virginia
VA
$77,093
13
Alaska
AK
$75,247
14
Minnesota
MN
$74,943
15
Illinois
IL
$74,197
16
South Dakota
SD
$73,959
17
Nebraska
NE
$71,859
18
Pennsylvania
PA
$71,148
19
North Dakota
ND
$70,966
20
Oregon
OR
$70,685
21
Florida
FL
$70,390
22
Vermont
VT
$70,086
23
Rhode Island
RI
$69,936
24
Hawaii
HI
$69,520
25
Delaware
DE
$69,282
26
Nevada
NV
$68,657
27
Maine
ME
$68,129
28
Kansas
KS
$68,038
29
Texas
TX
$67,942
30
Montana
MT
$67,615
31
Wisconsin
WI
$67,586
32
Utah
UT
$66,443
33
Tennessee
TN
$64,908
34
North Carolina
NC
$64,855
35
Missouri
MO
$64,740
36
Arizona
AZ
$64,456
37
Ohio
OH
$64,225
38
Indiana
IN
$63,802
39
Iowa
IA
$63,573
40
Michigan
MI
$63,221
41
Oklahoma
OK
$62,661
42
Georgia
GA
$62,393
43
Idaho
ID
$61,836
44
Louisiana
LA
$61,332
45
South Carolina
SC
$59,995
46
Arkansas
AR
$59,663
47
New Mexico
NM
$57,652
48
Kentucky
KY
$57,526
49
Alabama
AL
$56,684
50
West Virginia
WV
$55,138
51
Mississippi
MS
$52,017
Massachusetts follows at $93,927, powered by its robust education, healthcare, and tech sectors.
Connecticut, with its strong finance and insurance industries, comes in third at $93,235.
All three leaders are at nearly twice the income last-ranked Mississippi ($52,017), reflecting the impact of specialized, high-skill industries on local income levels.
Meanwhile, New York ($85,733), New Jersey ($84,071), and New Hampshire ($82,878) keep the broader Northeast near the top of the distribution.
America’s West: The Tech Juggernaut
California ($85,518) and Washington ($83,938) both place in the top 10 states by income.
Their high incomes are linked to thriving technology and innovation economies, with major employers like Apple, Microsoft, and Google anchoring the regions.
These states also attract high-skilled migrants, further boosting wage levels.
American South Incomes Still Underperform
The bottom of the ranking is dominated by Southern states, with Mississippi at $52,017 and West Virginia at $55,138.
Lower wages, coupled with economies centered on agriculture and lower-wage manufacturing, contribute to these figures.
These same states also have a higher rate of poverty, but also a lower cost of living.
If you enjoyed today’s post, check out Mapped: The Purchasing Power of $100 in Each U.S. State on Voronoi, the new app from Visual Capitalist.
Tyler Durden
Fri, 08/15/2025 – 06:55