


The Market Cycles Potentially Driving 2026 Returns
Authored by Lance Roberts via RealInvestmentAdvice.com,
Market cycles are once again at the center of the investment narrative as we head into 2026. The optimism is familiar as earnings held up in 2025, the economy avoided recession, and big tech lifted the indexes. However, those victories are already reflected in the price. As we head into 2026, with valuations extended, the margin for error has narrowed. However, while analysts are very optimistic for this year, the case for another strong year leans heavily on historical patterns.
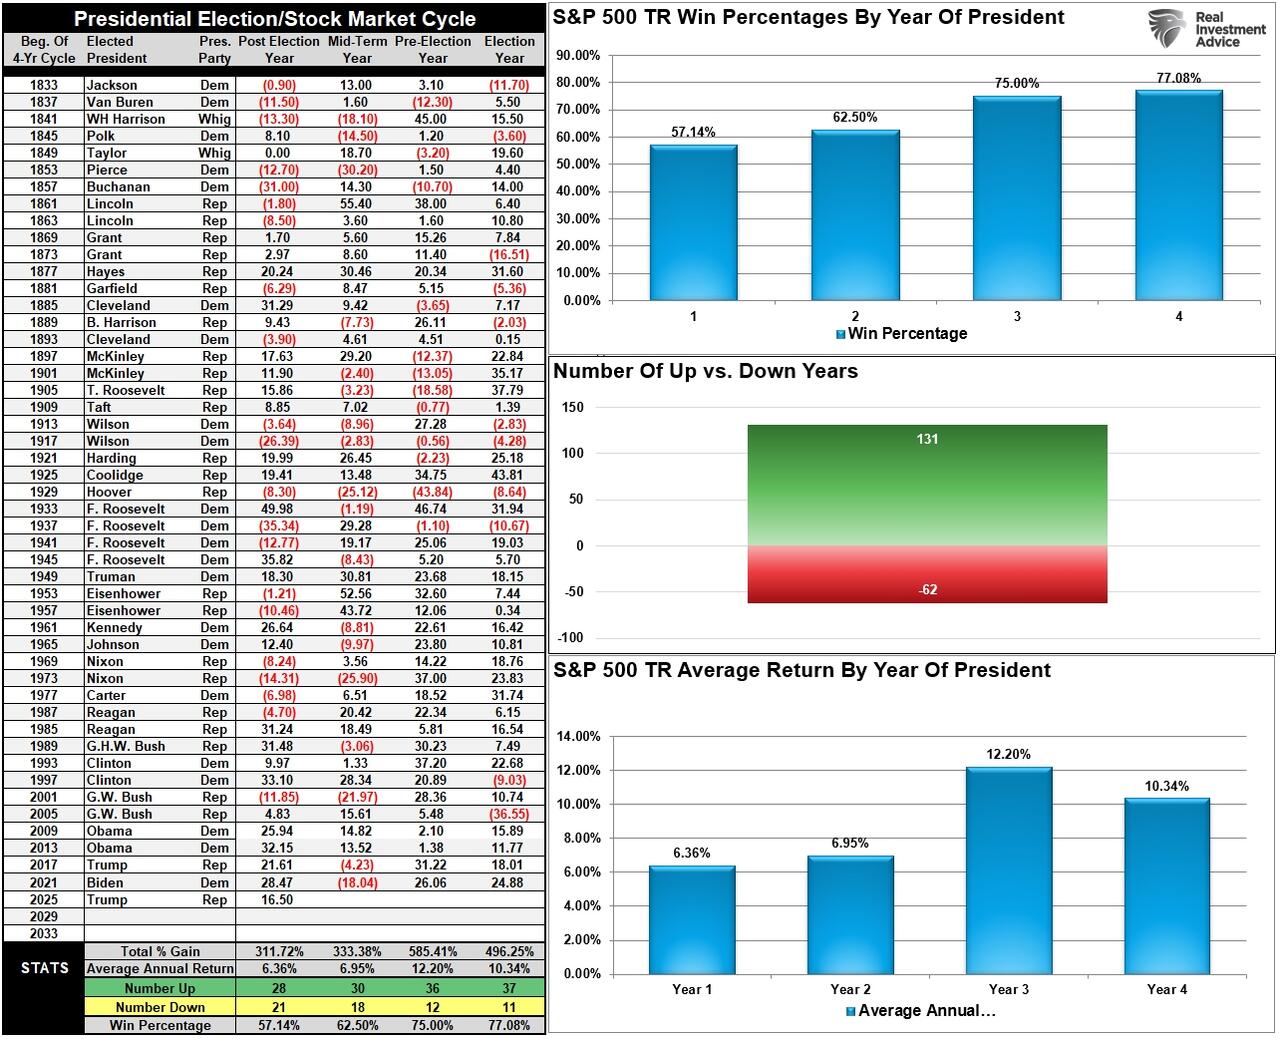
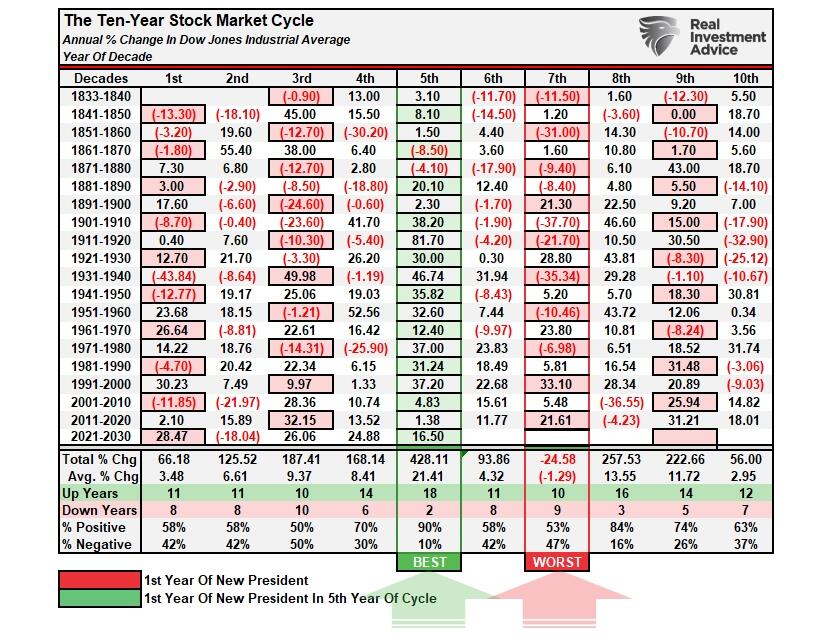
Let’s start with the Presidential Cycle. Market cycles tied to the presidential calendar suggest the second year of a new administration is often slower. Since 1948, years three and four of a presidential term have yielded the most substantial returns, while year two, or the post-election year, has shown weaker performance, with modest gains and lower win rates. The data is shown below, and while 2025 traded above historical norms, 2026 may not be as fortunate.
Since 1871, markets have gained in 30 of those years, with losses in only 18, resulting in a win rate of approximately 62%. While better than a “coin toss,” it falls well short of the win rate in years three and four. Another potential headwind to the markets in 2026 is the midterm elections, which could potentially result in a change of control in the House or Senate, leading to increased gridlock in Washington.
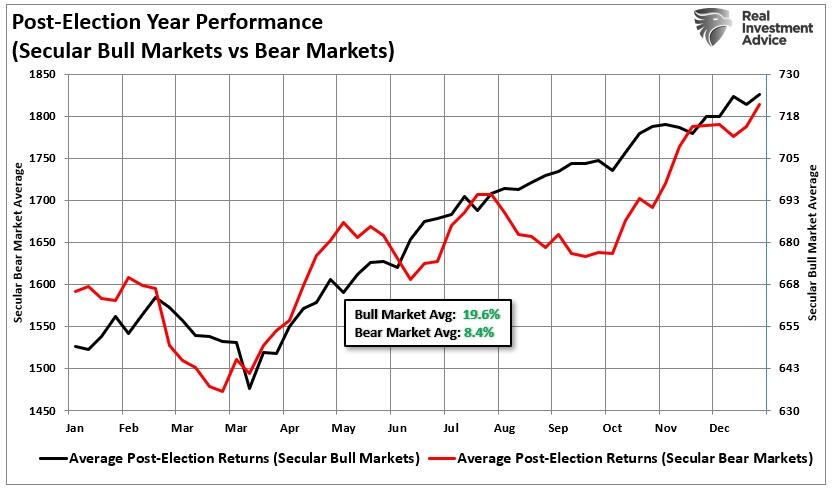
It is worth noting that since 1948, there have been seven instances of loss during the second year of the presidential cycle. Two of those losses occurred sequentially during the last two administrations, in 2018 and 2022. However, stocks have, on average, performed better during bull market cycles versus bear market cycles. The chart below illustrates the average market return during both bullish and bearish market cycles during the second year of a Presidential term.
With a “win ratio” of 62%, the media has been quick to assume the bull market will continue unabated. However, there is a 38% chance that a bear market will occur, which is not to be taken lightly. Furthermore, given the current duration, magnitude, and valuation issues associated with the market, a “Vegas handicapper” might increase those odds slightly.
Year 6 Of The Decennial Cycle
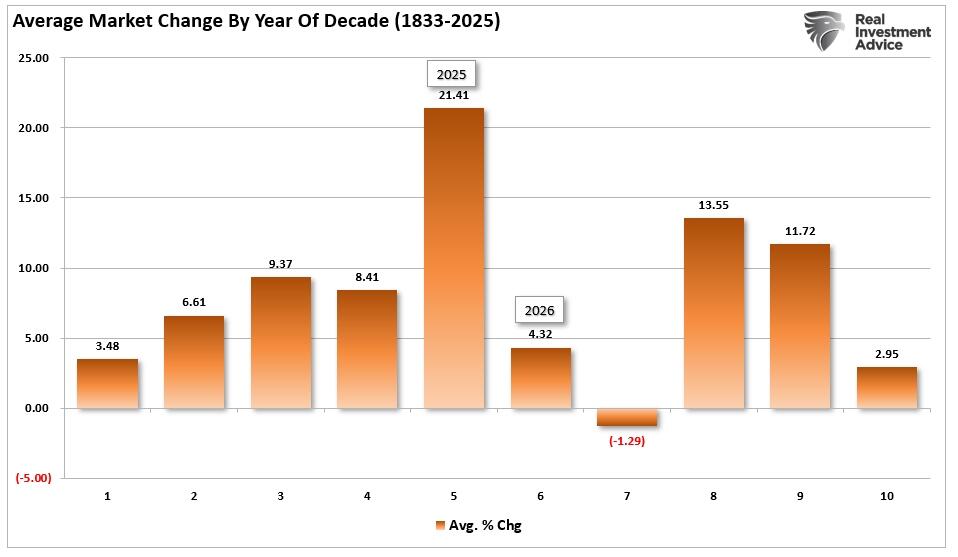
Then there’s the decennial trend. Market cycles built around decade shifts show the sixth year of each decade tends to underperform. In fact, only the 7th and 10th years have weaker returns. While 2025, the 5th year of the cycle, performed in line with historical averages, years 6 and 7 (2026 and 2027) suggest some caution. Average returns are 4% and -1.2% respectively, with the win/loss ratio barely better than a “coin toss.”
We can further assess the potential risk by examining the average market change by year of the decennial cycle. As noted while 2025 performed near historical norms, the risk of a lower return year in 2026 seems to be elevated.
While the Presidential and Decennial cycles are not guarantees of lower to negative returns in 2026, the analysis suggests that investors should at least exercise caution when it comes to risk management. With valuations elevated, risk-taking and speculation high, and sentiment very bullish, there seems to be a higher risk of disappointment than not.
A resurgence of interest rates that impact corporate profitability
Inflation rises, causing the Federal Reserve to halt rate cuts.
An economic slowdown, or mild recession, that results in a decline in forward earnings.
A financial or credit-related event that causes a repricing of market valuations.
You get the idea. The current setup reflects that with earnings growth rates slowing, the consumer is leveraged, and while inflation is lower, it remains sticky. The Federal Reserve is caught between weak growth and elevated prices. Betting on another strong year without acknowledging the weight of these market cycles is a dangerous assumption.
Cycles don’t dictate market direction. But they shape investor psychology, and when both primary market cycles suggest caution, it’s not the time to get aggressive.
The “Technical” Risk of Reversion
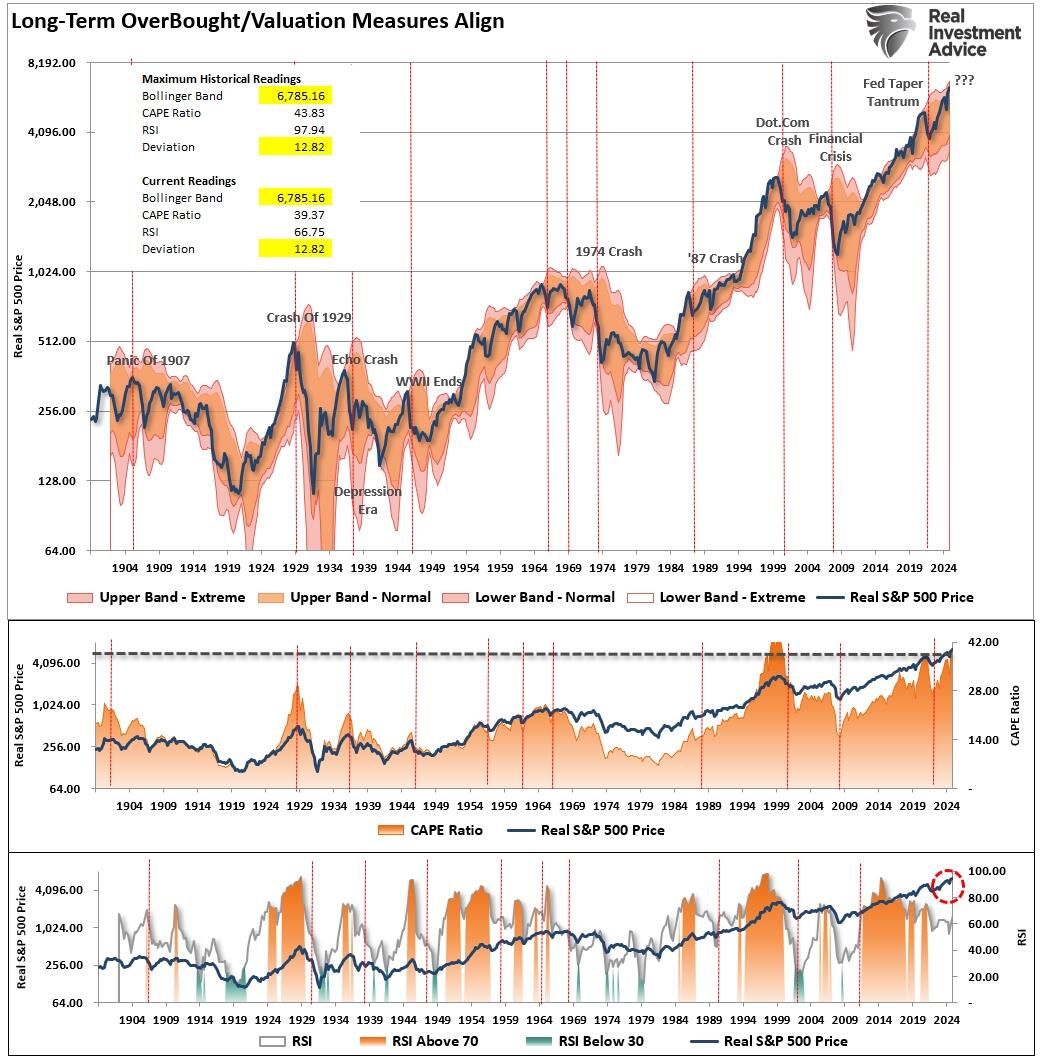
Market cycles work because they reveal investor behavior. Bull phases are driven by optimism, liquidity, and earnings growth. Bear phases follow when expectations exceed reality. Right now, we’re on the edge of that shift. The Shiller CAPE ratio is trading well above its long-term average, and market prices are outpacing profits by a wide margin. That’s a signal, not noise. Market cycles have always corrected this type of divergence. In 1999, the last time we saw a similar disconnect, the result was a steep and painful correction.
What’s worse is that earnings growth in 2025 leaned on familiar crutches: cost cuts, financial engineering, and suppressed wages. Margins held up, but revenue growth did not. Now, consumer wages are declining, resulting in slower spending, and forward guidance is being revised lower. That’s not a setup that aligns with the optimism baked into current prices. For example, Bank of America’s 2026 outlook clearly sees this. Their analysts project weaker consumer demand and downside risk to earnings. However, BNP Paribas is more bullish, projecting the S&P 500 at 7,500, but even they admit that it depends on strong economic momentum and falling rates.
This is where market cycles come back into focus. Every long-term chart illustrates the same lesson: when valuations outpace fundamentals, reversion is inevitable. It’s not always immediate. It’s rarely obvious. But it’s consistent. And 2026 is shaping up as a test of whether this time is different—or not.
In September 2021, I produced the following chart stating:
“A market melting-up is exciting while it lasts. During melt-ups, investors rationalize why ‘this time is different.’ They start taking on excess leverage to try and capitalize on the rapid advance in prices, and fundamentals take a back seat to price momentum. Market melt-ups are all about ‘psychology.’ Historically, whatever has been the catalyst to spark the disregard of risk is readily witnessed in the corresponding surge in price and valuations. The chart below shows the long-term deviations in relative strength, deviations, and valuations. The previous ‘melt-up’ periods should be easy to spot when compared with the current advance.”
Of course, just three months later, the market began a nine-month correction that clipped roughly 25% off asset prices before bottoming in October 2022.
The chart has been updated through the end of 2025. It is worth noting that prices are again deviating from the long-term mean, valuations are extended, and relative strength is declining. Furthermore, investors are taking on increasing speculative risk and leverage, much like they did in 2021. Expectations for corporate earnings, the lifeblood of market performance, appear overly ambitious, and analysts are projecting another high double-digit increase in earnings for the year, a figure well above historical trends. However, these projections may not align with economic realities, particularly if consumer demand softens, the global economy slows further, or cost pressures persist.
The chart below uses quarterly data, so it is slow to move. It is worth noting that the current market is significantly deviated from its long-term mean, with the second-highest levels of valuation on record. While many claim that “this time is different,” long-term analysis suggests that it likely isn’t.
In 2025, actual earnings growth fell short of the original forecasts but remained decently strong overall. However, much of the market’s performance in 2025 was driven by valuation expansion rather than fundamental earnings growth. If this pattern continues, the risk of a correction increases. With all “experts” currently expecting above-average economic growth and earnings rates in 2026, investors should consider remaining more risk-conscious. As discussed in “Bob Farrell’s 10-Illustrated Rules:”
“Rule #9: When all experts and forecasts agree, something else will happen.”
Such certainly seems a risk to consider as we head into the new year.
Investors would be wise to treat this phase of the market cycle with discipline. The choice is yours.
“Chase returns, and you’ll likely end up paying for it. Manage risk, and you’ll still be around when the next true bull leg begins.“
How to Position for Market Cycles in 2026
I am always reticent to discuss taking a more “risk-averse” approach to the markets. This is because investors typically interpret such commentary as “sell everything and go to cash.”
While 2026 presents its share of challenges, the solution is not to abandon the market altogether. Instead, investors can take practical steps to navigate these uncertainties.
None of this means the next “bear market” is lurking. The data suggest that being overly aggressive, taking excessive risk, and increasing leverage may not yield the desired outcome. Since exceedingly bullish markets are primarily a function of psychology, they can persist longer and extend further than logic predicts. The requirement to “end” such a phase is an exogenous event that changes psychology from bullish to bearish. Such is when the stampede for the exits occurs, and prices can decline very quickly. As such, investors need guidelines to participate in the market advance. However, the real challenge is maintaining those gains when corrections inevitably occur.
Positioning for 2026 means respecting our current market position. This is not a time to lean into high-beta names or speculative stories. This is a time to manage risk, preserve capital, and focus on quality. With both the presidential and decennial market cycles signaling below-average returns, prudence is more valuable than prediction.
Tighten up stop-loss levels to current support levels for each position. (Provides identifiable exit points when the market reverses.)
Hedge portfolios against significant market declines. (Non-correlated assets, short-market positions, index put options)
Take profits in positions that have been big winners. (Rebalancing overbought or extended positions to capture gains but continuing to participate in the advance).
Sell laggards and losers. (If something isn’t working in a market melt-up, it most likely won’t work during a broad decline. It is better to eliminate the risk early.)
Raise cash and rebalance portfolios to target weightings. (Rebalancing risk regularly keeps hidden risks somewhat mitigated.)
Notice, nothing in there says, “Sell everything and go to cash.”
Investing in 2026 will require a blend of optimism and caution. With slowing economic growth, fiscal policy uncertainties, global challenges, overconfident sentiment, and ambitious earnings expectations, investors have numerous reasons to approach the markets with caution. There will be a time to raise significant cash levels. A good portfolio management strategy will ensure that exposure decreases and cash levels rise when the selling begins.
The most important thing to remember is that market cycles are not about exact timing. They’re about understanding the rhythm of investor psychology, capital flows, and fundamental trends. In 2026, that rhythm suggests caution. Stay liquid. Stay hedged. And don’t forget—every market cycle eventually resets. Your job is to be still standing when it does.
Remember, as Larry David might say,
“You don’t have to be a genius—just don’t be a schmuck.”
Tyler Durden
Mon, 02/02/2026 – 12:40