


These Are The Best And Worst Countries For Taxes
When global companies decide where to invest, the quality of a country’s tax code can be as important as market size or labor costs.
A simpler, more neutral code helps investors forecast returns and reduces compliance headaches.
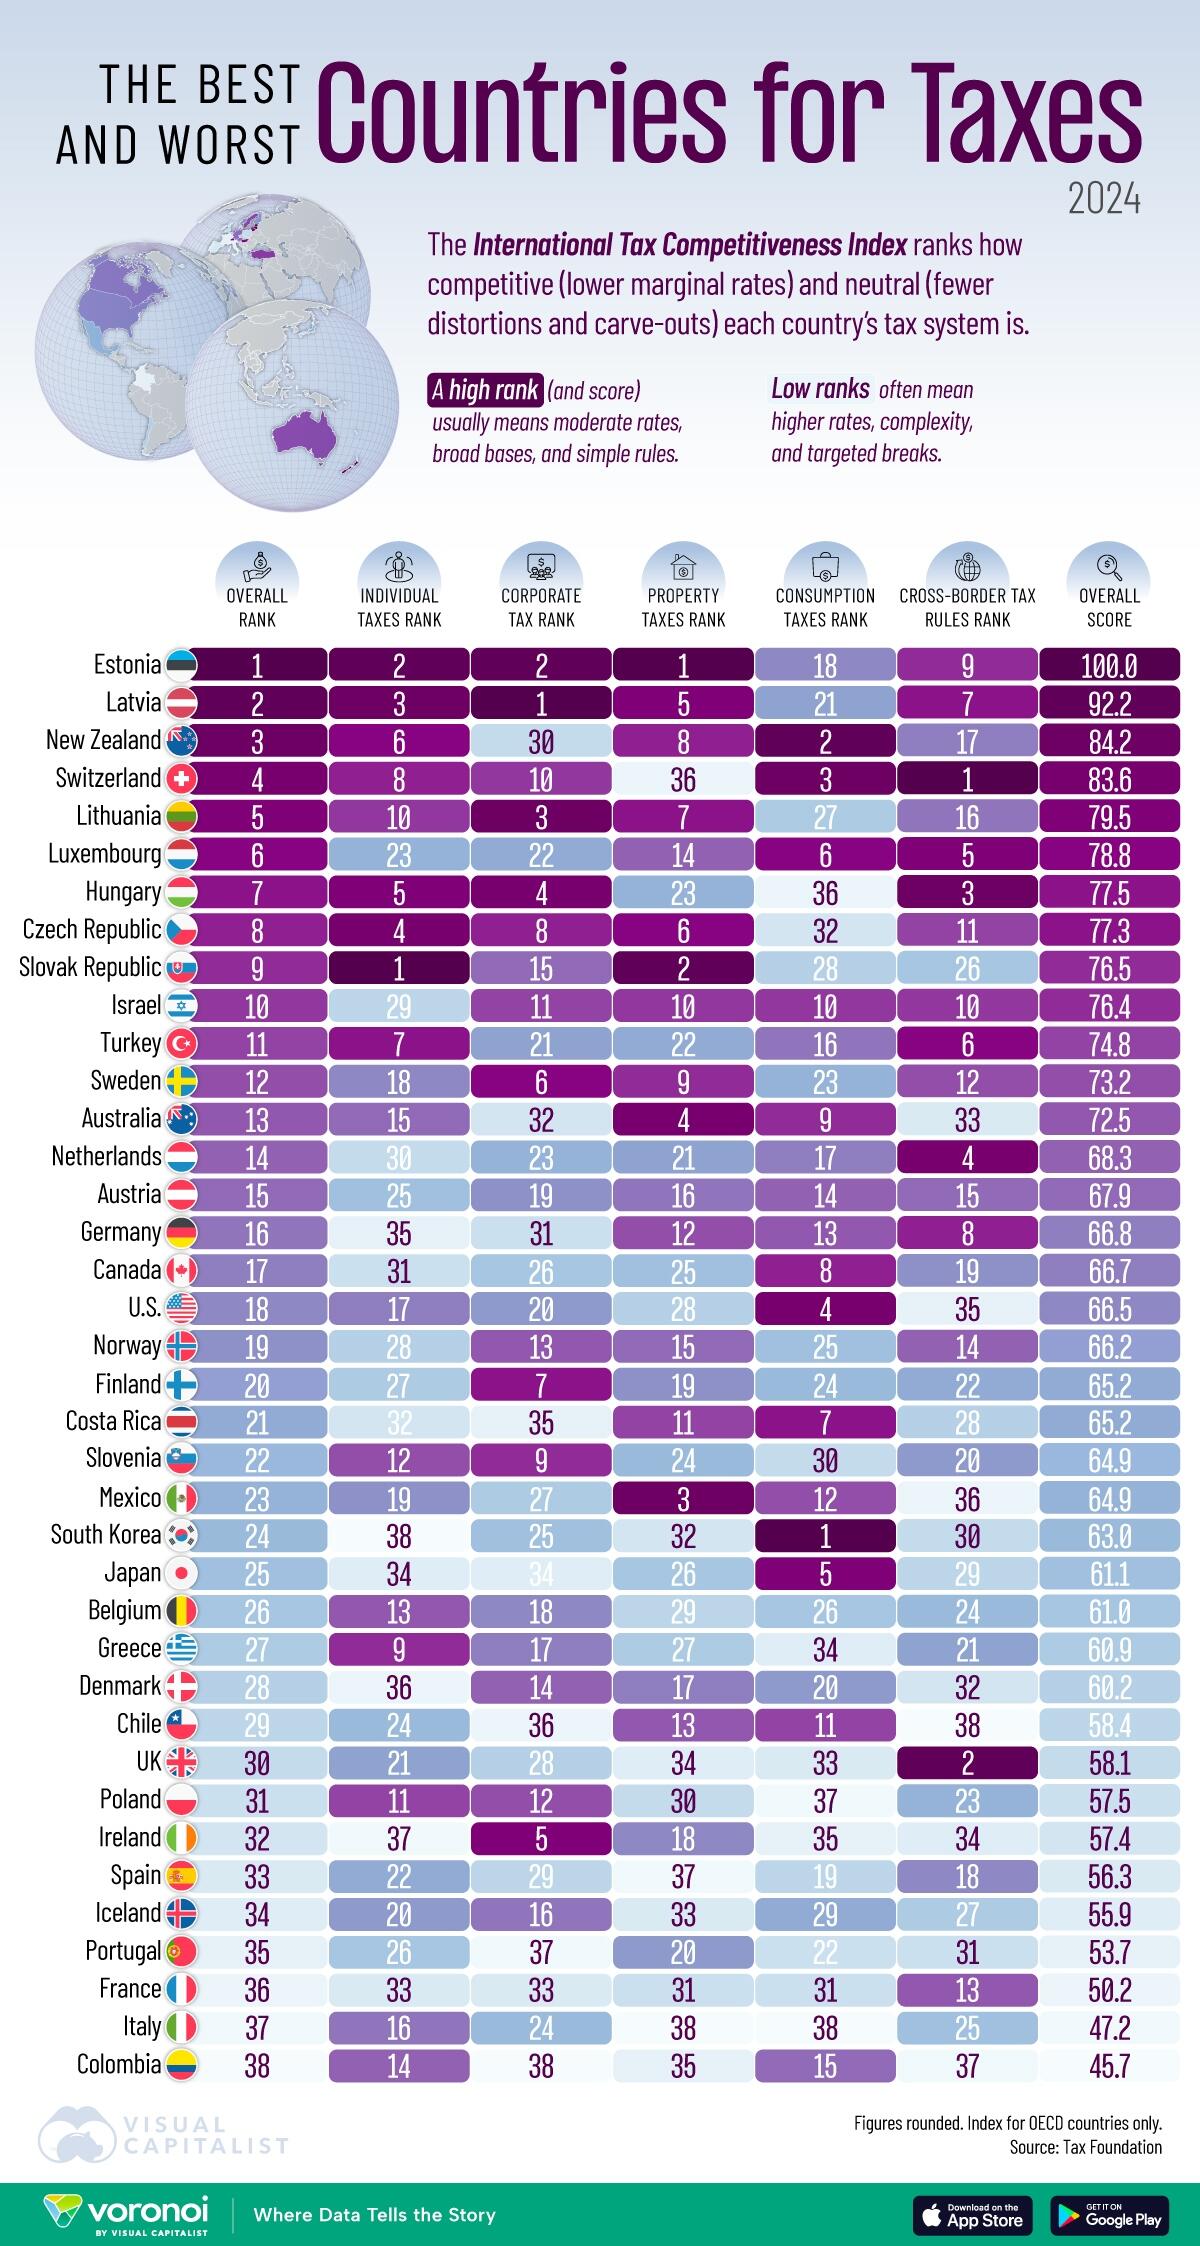
The data for this visualization from Visual Capitalist’s Pallavi Rao, comes from the Tax Foundation’s 2024 International Tax Competitiveness Index.
It benchmarks Organisation for Economic Co-operation and Development (OECD) members on how efficiently they raise revenue through individual, corporate, property, and consumption taxes, plus their rules on cross-border profits.
Estonia: Best Tax Code in the World?
Estonia tops the index for the 11th straight year, scoring a perfect 100.
Rank
Country
Score
Individual
Taxes Rank
Corporate
Tax Rank
1
🇪🇪Estonia
100.0
2
2
2
🇱🇻Latvia
92.2
3
1
3
🇳🇿New Zealand
84.2
6
30
4
🇨🇭Switzerland
83.6
8
10
5
🇱🇹Lithuania
79.5
10
3
6
🇱🇺Luxembourg
78.8
23
22
7
🇭🇺Hungary
77.5
5
4
8
🇨🇿Czech Republic
77.3
4
8
9
🇸🇰Slovak Republic
76.5
1
15
10
🇮🇱Israel
76.4
29
11
11
🇹🇷Turkey
74.8
7
21
12
🇸🇪Sweden
73.2
18
6
13
🇦🇺Australia
72.5
15
32
14
🇳🇱Netherlands
68.3
30
23
15
🇦🇹Austria
67.9
25
19
16
🇩🇪Germany
66.8
35
31
17
🇨🇦Canada
66.7
31
26
18
🇺🇸U.S.
66.5
17
20
19
🇳🇴Norway
66.2
28
13
21
🇨🇷Costa Rica
65.2
32
35
20
🇫🇮Finland
65.2
27
7
23
🇲🇽Mexico
64.9
19
27
22
🇸🇮Slovenia
64.9
12
9
24
🇰🇷Korea
63.0
38
25
25
🇯🇵Japan
61.1
34
34
26
🇧🇪Belgium
61.0
13
18
27
🇬🇷Greece
60.9
9
17
28
🇩🇰Denmark
60.2
36
14
29
🇨🇱Chile
58.4
24
36
30
🇬🇧UK
58.1
21
28
31
🇵🇱Poland
57.5
11
12
32
🇮🇪Ireland
57.4
37
5
33
🇪🇸Spain
56.3
22
29
34
🇮🇸Iceland
55.9
20
16
35
🇵🇹Portugal
53.7
26
37
36
🇫🇷France
50.2
33
33
37
🇮🇹Italy
47.2
16
24
38
🇨🇴Colombia
45.7
14
38
Its 20% flat tax on both personal and corporate income is only due when profits are distributed, rewarding reinvestment and limiting double taxation.
The country also avoids wealth or inheritance taxes and keeps real-property levies local, reducing distortions.
Combined, these features create an easy-to-administer system that fuels the Baltic state’s startup scene and steady foreign investment.
The Baltic Cluster Outperforms Larger Peers
Latvia (2nd) and Lithuania (5th) join Estonia in the top five, underscoring a regional push for flat-rate, low-complexity regimes.
All three Baltic nations tax corporate profits only once and apply modest payroll charges, making cross-border hiring simpler.
Their high rankings contrast with many bigger EU economies—Germany (16th) and France (36th)—that rely on layered surcharges and targeted deductions, increasing compliance costs even as statutory rates fall.
Why Major Economies Lag Behind in the Tax Index
Size alone doesn’t guarantee a competitive tax code.
The U.S. ranks solidly middle-of-the-pack, weighed down by its citizenship tax system that can tax on overseas income and profits.
Meanwhile, France and Italy sit at the bottom of the table, burdened by high payroll taxes and narrow consumption-tax bases.
Country
Property
Taxes Rank
Consumption
Taxes Rank
Cross-Border
Tax Rules Rank
🇪🇪Estonia
1
18
9
🇱🇻Latvia
5
21
7
🇳🇿New Zealand
8
2
17
🇨🇭Switzerland
36
3
1
🇱🇹Lithuania
7
27
16
🇱🇺Luxembourg
14
6
5
🇭🇺Hungary
23
36
3
🇨🇿Czech Republic
6
32
11
🇸🇰Slovak Republic
2
28
26
🇮🇱Israel
10
10
10
🇹🇷Turkey
22
16
6
🇸🇪Sweden
9
23
12
🇦🇺Australia
4
9
33
🇳🇱Netherlands
21
17
4
🇦🇹Austria
16
14
15
🇩🇪Germany
12
13
8
🇨🇦Canada
25
8
19
🇺🇸U.S.
28
4
35
🇳🇴Norway
15
25
14
🇨🇷Costa Rica
11
7
28
🇫🇮Finland
19
24
22
🇲🇽Mexico
3
12
36
🇸🇮Slovenia
24
30
20
🇰🇷Korea
32
1
30
🇯🇵Japan
26
5
29
🇧🇪Belgium
29
26
24
🇬🇷Greece
27
34
21
🇩🇰Denmark
17
20
32
🇨🇱Chile
13
11
38
🇬🇧UK
34
33
2
🇵🇱Poland
30
37
23
🇮🇪Ireland
18
35
34
🇪🇸Spain
37
19
18
🇮🇸Iceland
33
29
27
🇵🇹Portugal
20
22
31
🇫🇷France
31
31
13
🇮🇹Italy
38
38
25
🇨🇴Colombia
35
15
37
These choices are by design, in pursuit of broadening the social security net, but they also increase distortions and freeze cross-border capital flows.
The Other Side of “Tax Competitiveness”
Tax Competitiveness as measured by the Tax Foundation prioritizes business mobility and investment flows over other policy goals like:
Reducing inequality
Funding robust public services
Long-term fiscal sustainability
Democratic choice about the size of government
Estonia’s system works well for attracting capital and businesses, but may be sub-optimal for building a comprehensive welfare state or addressing inequality. And many would argue those are equally important measures of a good tax system.
If you enjoyed today’s post, check out Taxes Collected Relative to GDP Size in Every Major Economy on Voronoi, the new app from Visual Capitalist.
Tyler Durden
Thu, 08/28/2025 – 04:15