


These Are The US States With The Most Low-Wage Workers
Low-wage work remains widespread across the United States. Even as the labor market continues to expand, wage gains have been uneven, leaving millions of workers earning less than $20 per hour, which is roughly $41,600 annually before taxes for full-time work.
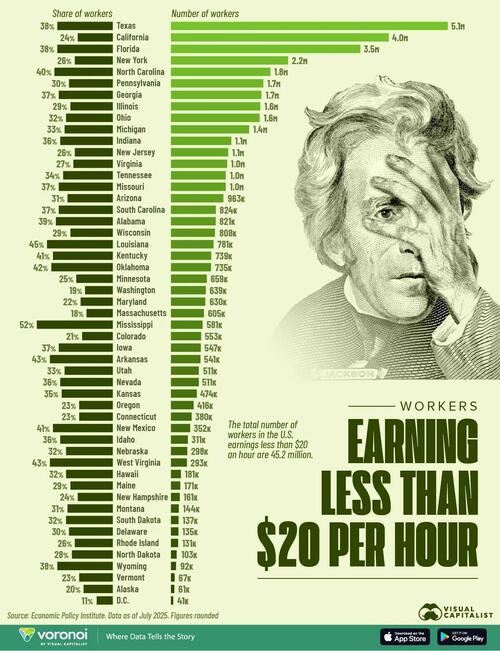
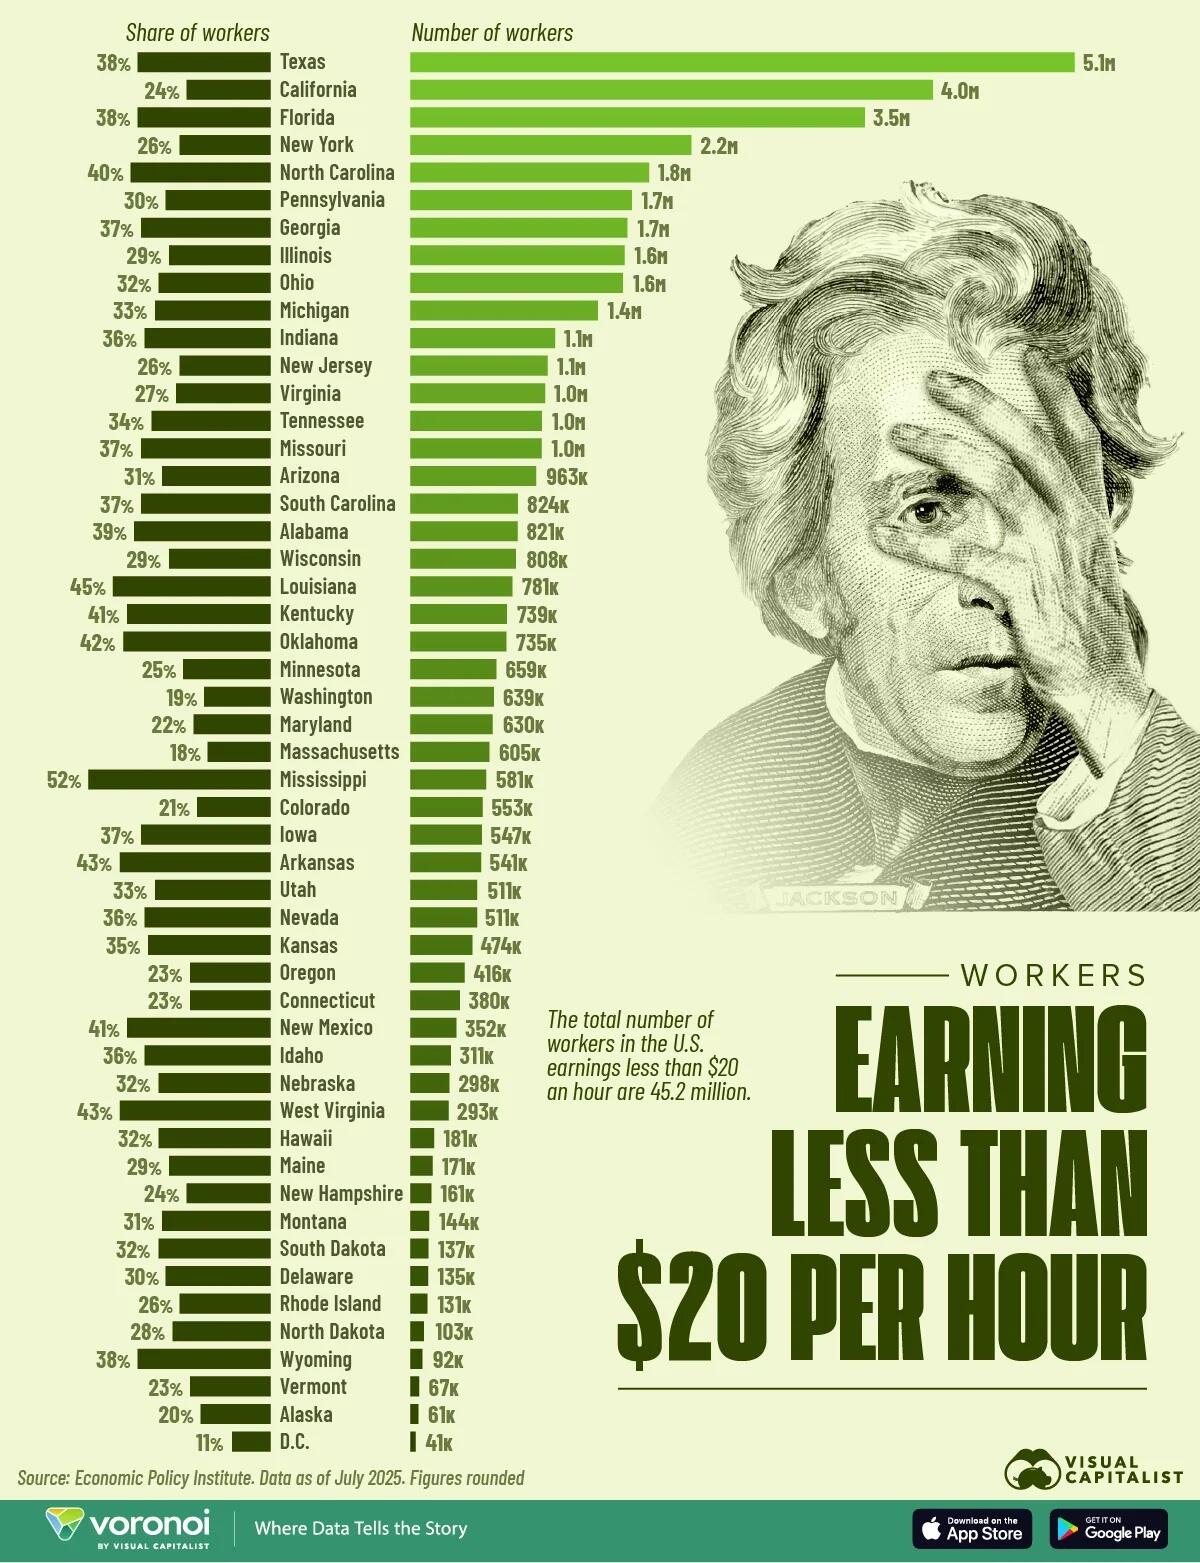
This infographic, via Visual Capitalist’s Niccolo Conte, ranks U.S. states by the share of low-wage workers earning less than $20 per hour, using data from the Economic Policy Institute as of July 2025.
Low-Wage Workforce by State
Nationally, three in 10 workers, or 45.2 million people, fall below the $20-per-hour mark. However, this distribution varies widely by state.
The table below shows the full ranking of states by the share and number of workers earning less than $20 per hour:
Texas tops the list in terms of the number of low-wage workers with nearly 5.1 million people below the $20-per-hour mark. California, the most populous state, follows with around 4 million workers, along with Florida (3.5 million) and New York (2.2 million).
Meanwhile, Mississippi leads in terms of the share of low-wage workers, with 52% of the state’s workers earning under $20 per hour. Other Southern states also rank high, including Louisiana (45%), Arkansas (43%), West Virginia (43%), and Kentucky (41%).
In contrast, the District of Columbia has the lowest share of low-wage workers at 11%, along with Washington (19%) and Massachusetts (18%). These states tend to have a larger share of workers employed in high-paying industries like professional services, health, and information (IT) as compared to states with more low-wage workers.
State
Share of workers below $20/hr
Number of workers below $20/hr
Texas
38%
5,089,000
California
24%
4,002,000
Florida
38%
3,481,000
New York
26%
2,152,000
North Carolina
40%
1,828,000
Pennsylvania
30%
1,696,000
Georgia
37%
1,662,000
Illinois
29%
1,641,000
Ohio
32%
1,627,000
Michigan
33%
1,437,000
Indiana
36%
1,108,000
New Jersey
26%
1,052,000
Virginia
27%
1,033,000
Tennessee
34%
1,007,000
Missouri
37%
1,005,000
Arizona
31%
963,000
South Carolina
37%
824,000
Alabama
39%
821,000
Wisconsin
29%
808,000
Louisiana
45%
781,000
Kentucky
41%
739,000
Oklahoma
42%
735,000
Minnesota
25%
659,000
Washington
19%
639,000
Maryland
22%
630,000
Massachusetts
18%
605,000
Mississippi
52%
581,000
Colorado
21%
553,000
Iowa
37%
547,000
Arkansas
43%
541,000
Nevada
36%
511,000
Utah
33%
511,000
Kansas
35%
474,000
Oregon
23%
416,000
Connecticut
23%
380,000
New Mexico
41%
352,000
Idaho
36%
311,000
Nebraska
32%
298,000
West Virginia
43%
293,000
Hawaii
32%
181,000
Maine
29%
171,000
New Hampshire
24%
161,000
Montana
31%
144,000
South Dakota
32%
137,000
Delaware
30%
135,000
Rhode Island
26%
131,000
North Dakota
28%
103,000
Wyoming
38%
92,000
Vermont
23%
67,000
Alaska
20%
61,000
District of Columbia
11%
41,000
Minimum Wage in the U.S.
The U.S. federal minimum wage has remained at $7.25 per hour since 2009. Adjusted for inflation, that wage now has significantly less purchasing power, making it even lower in real terms.
While more than half of U.S. states have enacted higher local minimum wages, the federal standard still applies in states without their own wage laws, many of which appear at the top of the low-wage workforce rankings.
The Raise the Wage Act, which proposes lifting the federal minimum wage to $17 over five years, has been introduced repeatedly since 2017 but has yet to pass.
If you enjoyed today’s post, see this graphic on Average Salary by State in the U.S. on Voronoi.
Tyler Durden
Mon, 12/15/2025 – 05:45