


US Employment Additions Accelerate As Retail Sales Soar In March
BofA’s (almost) omnipotent analysts forecasted a stronger than expected retail sales print this morning as tax refunds trump surging gas prices…
BofA credit/debit card spending data suggests stronger retail sales than estimates (consensus 1.4% headline, 1.4% ex auto, 0.2% control group) despite surging gas prices, driven by higher YTD tax refunds pic.twitter.com/6m6UvTpkr0
— zerohedge (@zerohedge) April 21, 2026
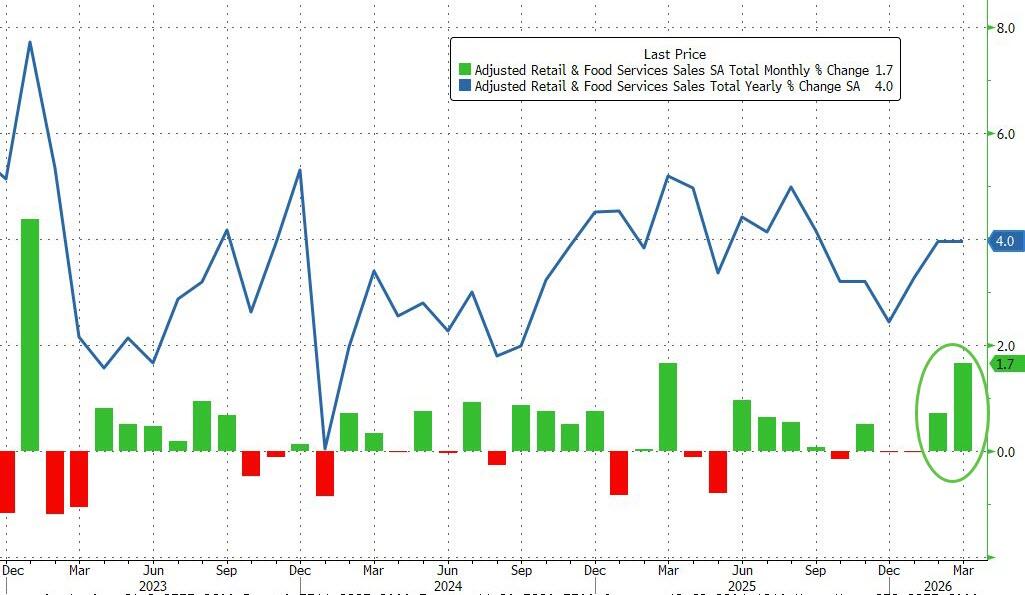
Headline retail sales printed +1.7% MoM in March (vs +1.4% MoM exp) – the strongest monthly rise since Jan 2023 – leaving retail sales up 4.0% YoY…
Source: Bloomberg
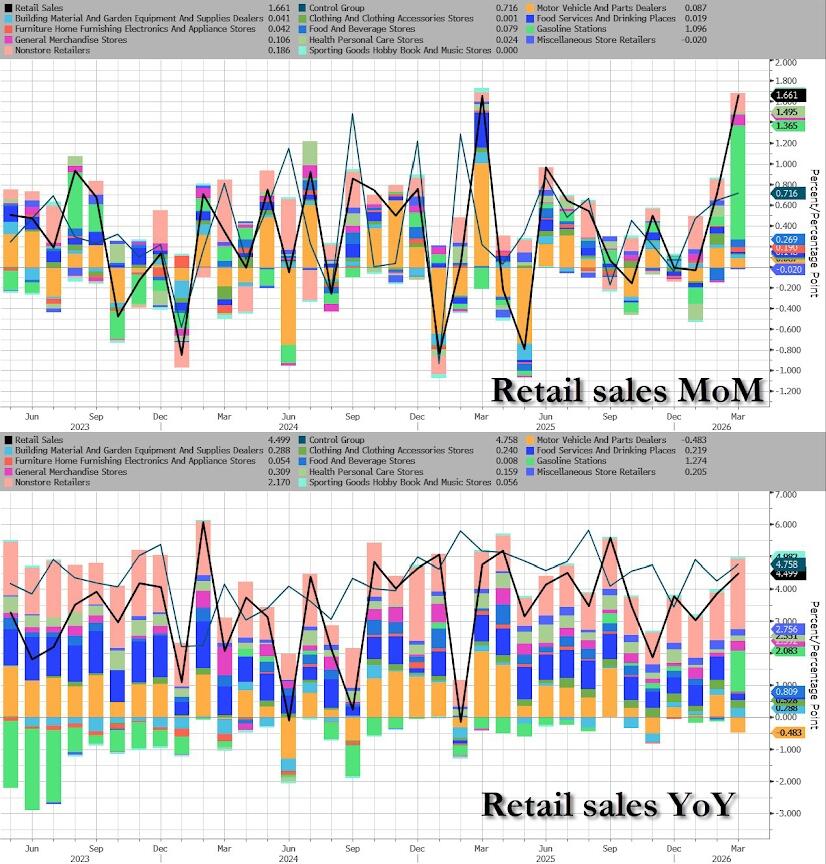
Under the hood, Gasoline Station spending dominated the surge in spending…
Source: Bloomberg
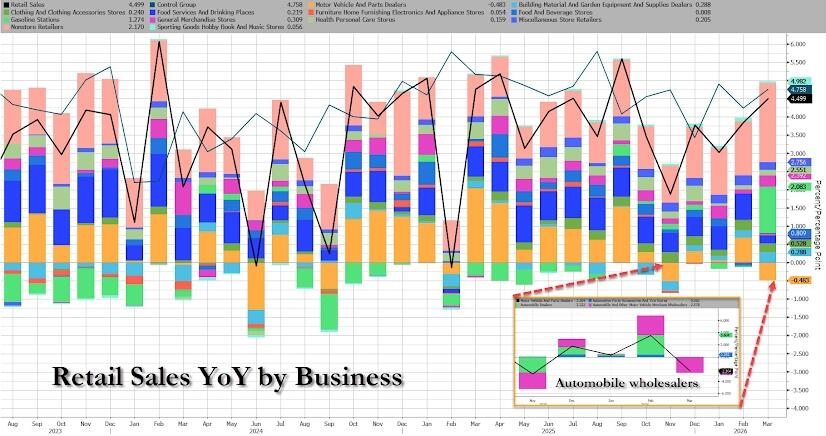
Automobile Wholesalers saw a sizable decline last month…
Source: Bloomberg
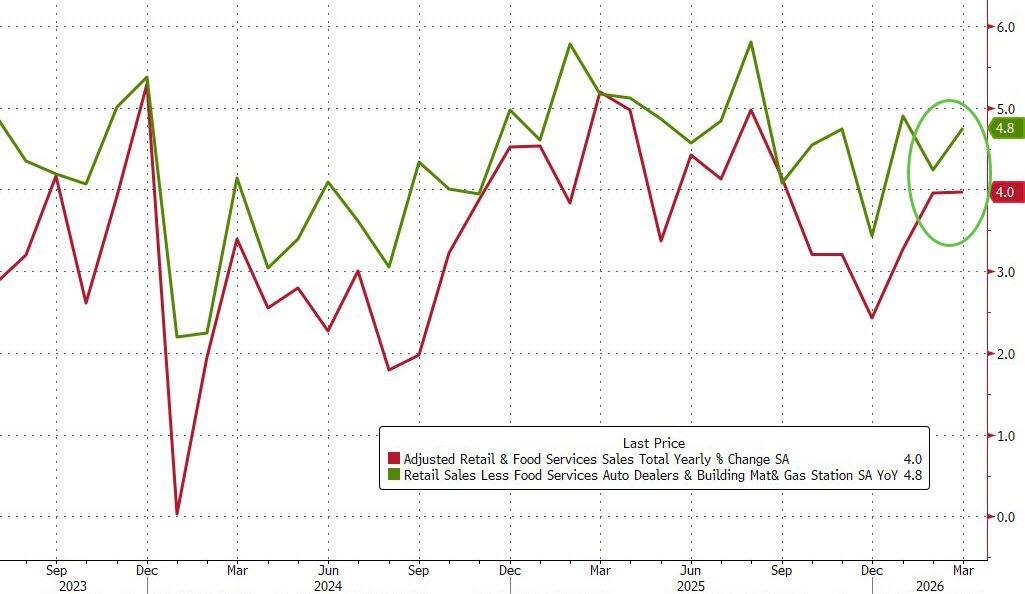
Ex-Autos and Ex-Autos-and-Gas both also beat expectations dramatically (+1.9% MoM vs +1.4% MoM and +0.6% MoM vs +0.3% MoM respectively).
Source: Bloomberg
The Retail Sales Control Group – which plugs directly into the GDP calculation – rose for the 3rd month in a row, up 0.7% MoM (smashing expectations of +0.2% MoM)…
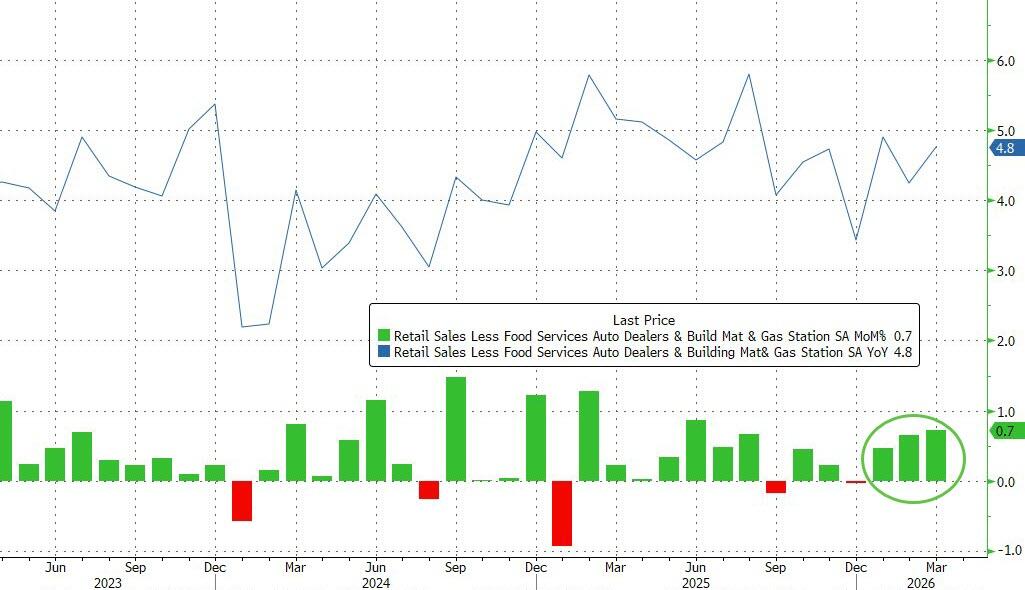
Source: Bloomberg
Here’s BofA’s color on what was behind the spending…
More paid at the pump, but still plenty left in the wallet
As expected, gas spending rose sharply in March reflecting higher gas prices. While energy’s share of total consumer spending has declined steadily over time, standing at about 4% as of January, it remains higher for lower income HHs than higher income HHs. Accordingly, y/y gas spending among lower income HHs rose slightly more than higher income HHs in the last few weeks. But, despite higher gas spending, most sectors posted m/m gains in March, and total card ex gas spending remained at healthy levels.
Limited equity sell-off, no sign of higher income pullback
One factor supporting ex gas card spending despite higher oil prices may be the largely contained equity market sell-off from the Iran war, with the peak to trough (end Jan to Mar) decline below 10%. We think a sustained sell-off in excess of 20% is needed for a meaningful pullback in higher income spending via negative wealth effects. Indeed, BAC data show little evidence that higher income HHs have curtailed spending
OBBBA related tax refunds continue to provide support
Second, the $45bn consumer stimulus from the OBBBA since the start of this year’s tax refund season, while smaller than our expectations, is still supportive. Also, BAC data show that YTD ’26 tax refund growth has been stronger among higher income HHs than lower income HHs. This is reverse of last year but is in line with expectations as OBBBA tax changes accrued more to HHs with higher tax liabilities. This further reinforces K-shaped consumer spending growth.
With all that in the background, we also note that ADP weekly employment change index soared once again last week to an average of 54,750 jobs added per week for the last four weeks…
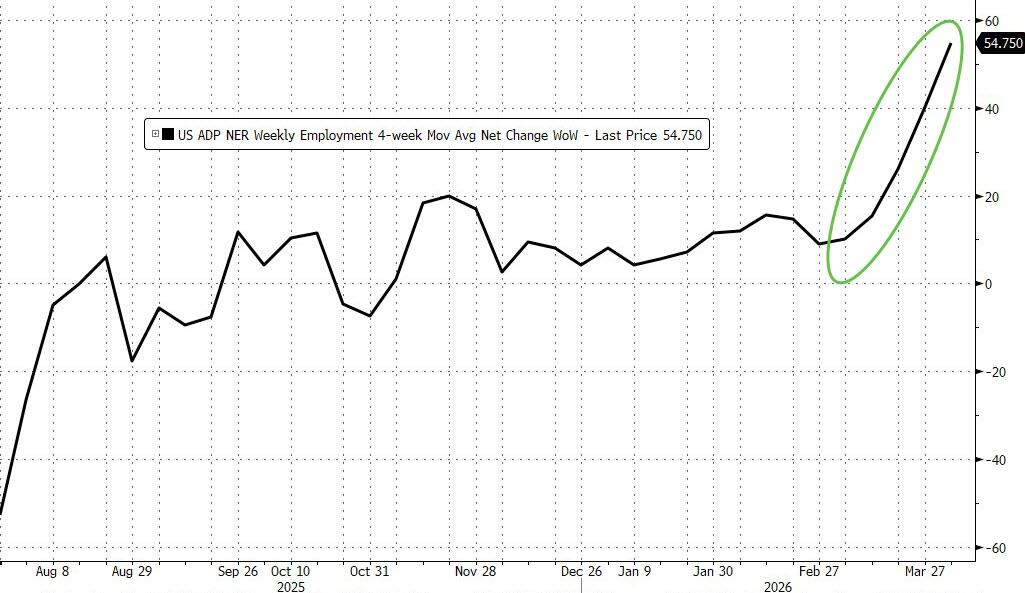
…and that was during the war – seems slumping consumer sentiment did not stall spending or employers’ confidence.
Tyler Durden
Tue, 04/21/2026 – 08:38