


What The Top 1% Richest Americans Pay In Taxes Across The US
This graphic, via Visual Capitalist’s Bruno Venditti, uses IRS data from 2022 analyzed by SmartAsset to show how much the richest people contribute to income tax revenue.
Where the Top 1% Pay the Largest Share of Taxes
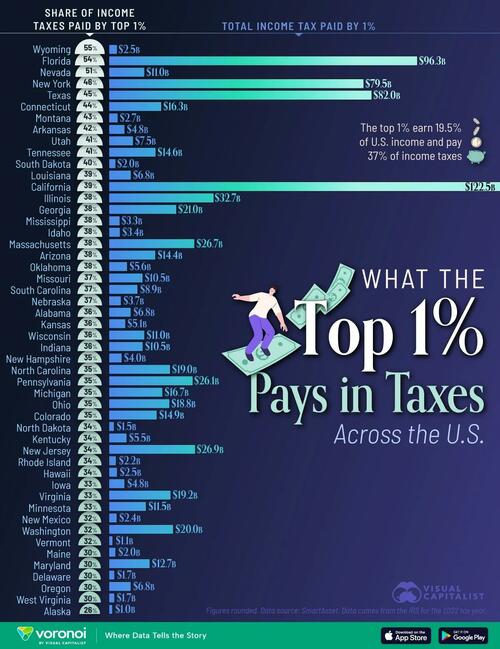
The table below includes each state’s share of income taxes paid by the top 1% and the total amount of income tax they paid.
Wyoming leads the nation, with the top 1% paying 54.67% of all state income taxes.
Florida and Nevada follow closely, both surpassing the 50% threshold.
These states attract high-income individuals in part due to tax-friendly policies and large concentrations of wealthy households.
Rank
State
Income taxes paid by top 1%
Total income tax paid by 1% (thousands of dollars)
1
Wyoming
54.67%
$2,460,940
2
Florida
53.62%
$96,264,565
3
Nevada
51.12%
$11,010,104
4
New York
46.26%
$79,488,609
5
Texas
44.52%
$81,990,700
6
Connecticut
43.85%
$16,284,881
7
Montana
42.92%
$2,690,156
8
Arkansas
42.22%
$4,814,153
9
Utah
41.16%
$7,477,634
10
Tennessee
41.04%
$14,547,566
11
South Dakota
40.46%
$2,020,508
12
Louisiana
38.72%
$6,806,423
13
California
38.60%
$122,452,981
14
Illinois
38.39%
$32,677,874
15
Georgia
38.31%
$21,001,340
16
Mississippi
38.29%
$3,297,109
17
Idaho
38.20%
$3,392,957
18
Massachusetts
38.19%
$26,646,912
19
Arizona
38.00%
$14,438,918
20
Oklahoma
37.80%
$5,622,529
21
Missouri
37.16%
$10,481,163
22
South Carolina
37.05%
$8,867,845
23
Nebraska
37.03%
$3,704,671
24
Alabama
36.15%
$6,778,809
25
Kansas
35.79%
$5,066,051
26
Wisconsin
35.54%
$11,024,109
27
Indiana
35.52%
$10,518,818
28
New Hampshire
35.41%
$3,946,877
29
North Carolina
35.28%
$19,037,365
30
Pennsylvania
35.09%
$26,128,752
31
Michigan
35.01%
$16,650,121
32
Ohio
34.60%
$18,842,538
33
Colorado
34.51%
$14,894,687
34
North Dakota
34.41%
$1,521,767
35
Kentucky
34.26%
$5,451,182
36
New Jersey
33.78%
$26,899,308
37
Rhode Island
33.58%
$2,150,700
38
Hawaii
33.57%
$2,455,554
39
Iowa
33.16%
$4,813,252
40
Virginia
32.94%
$19,239,261
41
Minnesota
32.64%
$11,524,941
42
New Mexico
32.30%
$2,380,544
43
Washington
32.06%
$20,012,467
44
Vermont
32.04%
$1,078,255
45
Maine
30.48%
$1,976,671
46
Maryland
30.45%
$12,675,749
47
Delaware
30.38%
$1,647,326
48
Oregon
30.37%
$6,773,041
49
West Virginia
30.28%
$1,647,747
50
Alaska
26.37%
$1,016,945
High-Population States with High-Dollar Contributions
In states like California, Texas, and New York, the share of taxes paid by the top 1% ranges from 39% to 46%, but the dollar amounts are higher due to population scale.
California’s top earners alone account for more than $122 billion in income taxes, the largest total contribution of any state.
High adjusted gross incomes—often above $2 million—mean that even moderate tax-share percentages translate into substantial revenue.
States with More Evenly Distributed Tax Burdens
States further down the ranking, such as Oklahoma, Arizona, and Idaho, still see the top 1% paying about 38% of income taxes.
Alaska sits at the bottom, with top earners paying 26%.
Across nearly every state, the top 1% shoulder between one-third and one-half of total income taxes.
If you enjoyed today’s post, check out Mean vs. Median: Visualizing Net Worth in the U.S. by Age Group on Voronoi, the new app from Visual Capitalist.
Tyler Durden
Fri, 12/12/2025 – 19:40