


Where The World’s Ocean Plastic Waste Comes From
In the past decade, plastic pollution has become one of the most visible environmental issues worldwide. Every year, millions of tonnes of plastic enter the ocean, affecting marine life, coastal communities, and ecosystems.
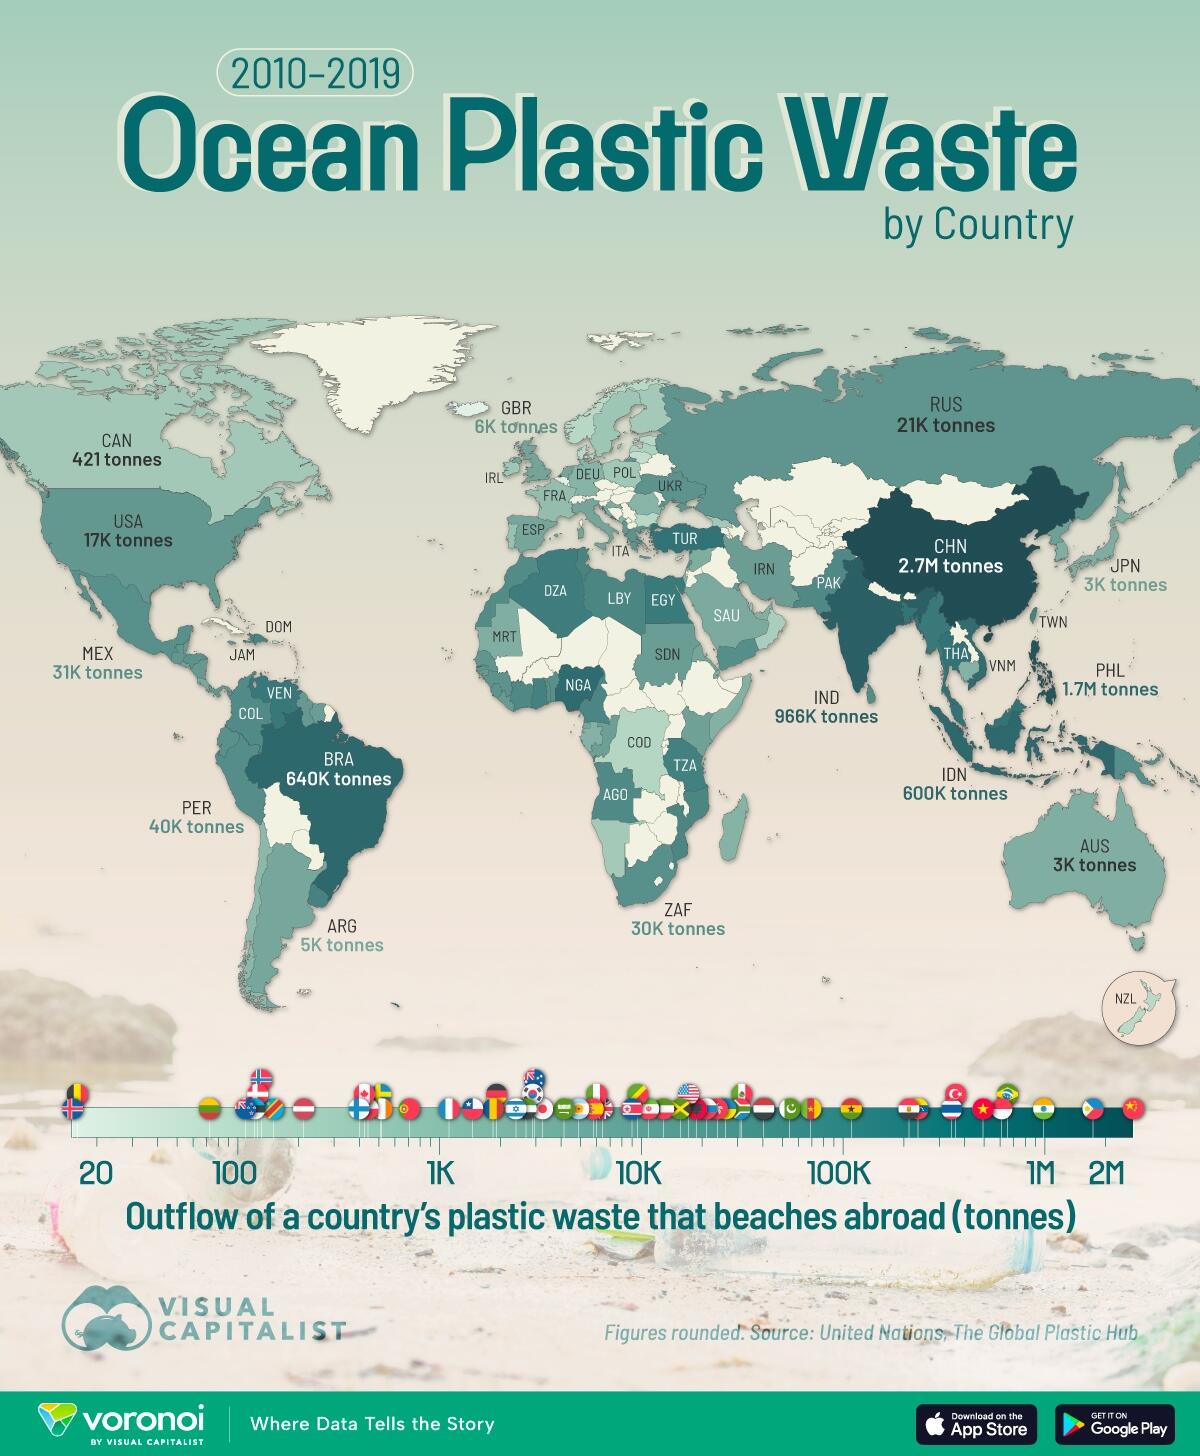
This visualization, via Visual Capitalist’s Bruno Venditti, ranks the countries responsible for the highest cumulative leakage of mismanaged plastic waste that escaped and washed up on other countries’ beaches from 2010 to 2019.
The data for this visualization comes from the Global Plastic Hub.
Asia Leads in Ocean Plastic Leakage
China is the largest contributor, responsible for over 2.6 million tonnes of plastic waste that ended up on foreign beaches.
It’s followed by the Philippines (1.7 million tonnes), and India (966,000 tonnes).
Rapid economic growth, urbanization, and inadequate waste management systems contribute to these high figures.
Seven of the top 10 countries on the list are in Asia, underlining the region’s central role in the global ocean plastic crisis.
Rank
Country
Tonnes (2010-2019)
1
🇨🇳 China
2,683,631
2
🇵🇭 Philippines
1,695,260
3
🇮🇳 India
966,447
4
🇧🇷 Brazil
639,665
5
🇮🇩 Indonesia
599,020
6
🇳🇬 Nigeria
496,841
7
🇻🇳 Viet Nam
484,457
8
🇹🇷 Turkey
354,441
9
🇹🇭 Thailand
338,685
10
🇲🇾 Malaysia
332,756
11
🇧🇩 Bangladesh
315,755
12
🇻🇪 Venezuela
231,132
13
🏝️ Bird Island
231,132
14
🇲🇲 Myanmar
209,495
15
🇪🇬 Egypt
208,321
16
🇩🇿 Algeria
157,952
17
🇹🇿 Tanzania
114,737
18
🇬🇭 Ghana
107,907
19
🇹🇼 Taiwan, Province of China
97,418
20
🇺🇾 Uruguay
94,544
21
🇹🇳 Tunisia
89,176
22
🇭🇹 Haiti
84,238
23
🇩🇴 Dominican Republic
83,121
24
🇱🇾 Libya
73,477
25
🇲🇿 Mozambique
72,578
26
🇨🇲 Cameroon
67,709
27
🇨🇮 Côte d’Ivoire
57,394
28
🇵🇰 Pakistan
53,641
29
🇦🇴 Angola
52,877
30
🇨🇴 Colombia
47,506
31
🇲🇦 Morocco
44,087
32
🇱🇰 Sri Lanka
41,648
33
🇵🇪 Peru
39,863
34
🇵🇬 Papua New Guinea
36,165
35
🇾🇪 Yemen
35,625
36
🇹🇹 Trinidad and Tobago
35,244
37
🇧🇯 Benin
32,298
38
🇹🇬 Togo
31,773
39
🇲🇽 Mexico
31,004
40
🇿🇦 South Africa
30,352
41
🇪🇨 Ecuador
29,678
42
🇸🇧 Solomon Islands
27,939
43
🇭🇳 Honduras
26,859
44
🇬🇷 Greece
25,983
45
🇺🇦 Ukraine
25,859
46
🇬🇳 Guinea
25,167
47
🇰🇲 Comoros
24,691
48
🇸🇱 Sierra Leone
23,826
49
🇭🇰 Hong Kong, China
23,471
50
🇷🇺 Russian Federation
20,770
51
🇸🇳 Senegal
19,569
52
🇱🇧 Lebanon
19,420
53
🇬🇹 Guatemala
19,015
54
🇦🇱 Albania
18,501
55
🇺🇸 U.S.
16,910
56
🇵🇦 Panama
16,346
57
🇯🇲 Jamaica
16,260
58
🇧🇿 Belize
15,383
59
🇬🇾 Guyana
15,235
60
🇳🇮 Nicaragua
15,199
61
🇱🇷 Liberia
14,220
62
🇰🇼 Kuwait
12,740
63
🇬🇲 Gambia
12,178
64
🇸🇷 Suriname
11,589
65
🇸🇩 Sudan
11,308
66
🇬🇼 Guinea-Bissau
10,819
67
🇮🇷 Iran
10,750
68
🇨🇬 Congo
9,476
69
🇰🇵 Democratic People’s Republic of Korea
8,873
70
🇰🇪 Kenya
7,941
71
🇸🇻 El Salvador
7,504
72
🇳🇱 Netherlands
6,488
73
🇬🇧 UK
6,242
74
🇹🇱 Timor-Leste
6,238
75
🇮🇹 Italy
5,930
76
🇪🇸 Spain
5,708
77
🇪🇸 Canary Islands (Sp.)
5,708
78
🇪🇷 Eritrea
5,677
79
🇬🇶 Equatorial Guinea
5,328
80
🇦🇷 Argentina
4,847
81
🇨🇷 Costa Rica
4,384
82
🇸🇦 Saudi Arabia
4,099
83
🇭🇷 Croatia
3,964
84
🇩🇯 Djibouti
3,401
85
🇯🇵 Japan
3,208
86
🇸🇾 Syrian Arab Republic
3,019
87
🇦🇺 Australia
2,920
88
🇦🇺 Ashmore & Cartier Is.
2,920
89
🇰🇷 Republic of Korea
2,865
90
🇲🇷 Mauritania
2,845
91
🇦🇪 United Arab Emirates
2,659
92
🇸🇴 Somalia
2,371
93
🇮🇱 Israel
2,368
94
🇫🇯 Fiji
2,340
95
🇰🇭 Cambodia
2,212
96
🇬🇦 Gabon
2,199
97
🇲🇬 Madagascar
2,132
98
🇩🇪 Germany
1,899
99
🇷🇴 Romania
1,825
100
🇲🇪 Montenegro
1,804
101
🇱🇨 Saint Lucia
1,591
102
🇨🇱 Chile
1,447
103
🇸🇹 Sao Tome and Principe
1,255
104
🇫🇷 France
1,105
105
🇻🇺 Vanuatu
997
106
🇨🇻 Cape Verde
975
107
🇶🇦 Qatar
868
108
🇼🇸 Samoa
809
109
🇧🇳 Brunei Darussalam
797
110
🇵🇹 Portugal
702
111
🇵🇹 Azores Islands (Port.)
702
112
🇵🇹 Madeira Islands (Port.)
702
113
🇬🇩 Grenada
553
114
🇸🇪 Sweden
514
115
🇮🇪 Ireland
508
116
🇻🇨 Saint Vincent and the Grenadines
466
117
🇵🇱 Poland
439
118
🇬🇪 Georgia
424
119
🇨🇦 Canada
421
120
🇩🇲 Dominica
408
121
🇫🇮 Finland
397
122
🇳🇦 Namibia
387
123
🇧🇧 Barbados
302
124
🇺🇸 Puerto Rico (USA)
287
125
🇴🇲 Oman
258
126
🇹🇴 Tonga
246
127
🇱🇻 Latvia
211
128
🇧🇭 Bahrain
204
129
🇧🇸 Bahamas
179
130
🇦🇬 Antigua and Barbuda
172
131
🇫🇲 Micronesia
167
132
🇨🇩 DRC
149
133
🇳🇴 Norway
130
Plastic Waste Doesn’t Stay Local
Plastic debris often travel thousands of kilometers across oceans, carried solely by currents, wind, tides, and time.
For example, the Great Pacific Garbage Patch—a massive swirling zone between California and Hawaii—accumulates plastic from as far as Asia, North America, and South America.
The patch spans around 1.6 million km², comparable to twice the size of Texas.
The annual economic costs due to marine plastic pollution are estimated to be between $6-19 billion. According to the OECD, preventing land-based plastic leakage into the ocean across 38 member countries and 10 major plastic waste emitters in Asia and Africa could cost more than $86 billion.
If you enjoyed today’s post, check out Ranked: The Most Expensive U.S. Wildfires, So Far on Voronoi, the new app from Visual Capitalist.
Tyler Durden
Tue, 09/09/2025 – 04:15